Hello folks and good to see you back for yet another article in our “Learn and solve it with Amped FIVE” series. As the countdown to Christmas is well underway, we take you away from your gift wrapping to discuss distances and timing data in video. Fasten your seat belts as we talk you through how to measure speed from surveillance video!
Speed Equals Distance in Time. Easy, but…
It is the equation that we all remember from our physics lessons at school, right? Velocity is the ratio between a spatial distance and a time unit. Makes sense, really, otherwise, we would not measure speed in miles per hour or meters per second.

But what is it about measuring a vehicle’s speed on surveillance footage that makes it so difficult and so prone to error? Well, just like anything else in video analysis, there are limitations and data inaccuracies associated with the video itself. These issues make it harder for us to reliably and accurately measure speed from CCTV and similar types of video evidence. Yet, video will probably be the primary, if not the only, evidence available from a collision or, worse, a fatal road incident. The determination of reliable data to calculate a speed range for such incidents will be key to the investigation and any subsequent criminal proceedings. As we know, speed can kill.
The difficulties come from accurately assessing both distance and time in video. For example, a low-resolution video and/or a vehicle considerably distant from the camera lens will make it harder for us to accurately calculate the distance of interest traveled. But what most laypersons don’t realize, is that calculating the exact timing intervals between every frame of interest, is equally, if not more, problematic to say the least.
The Issue with Timing
There are several different frame rates in a video. The evaluation of them, and then the correct interpretation of that data, helps in identifying inconsistencies and reliability. Not all sources of timing are available in every case.
- Base/Container Frame Rate – this will be a constant, singular value
- Stream Frame Rate – this is often a variable value, with a minimum and maximum frame rate
- Average – this is the rate calculated by dividing the amount of frames in a duration
- Presentation Time Stamp (PTS) – this is the timing data associated with every frame, informing the decoder of when to present that frame as an image
- Delta – this is the rate calculated by adding up all the durations between PTS and then dividing that by the amount of frames
- Pixel Embedded Timestamp – this is the timing data encoded into the image
- Subtitle Timestamp – this is a time-based text overlay giving time and date information
- Data Timestamp – this is frame-based proprietary data relating to the date and time
Timestamps are not timecode. Timecode relates to a set frame rate. As we have learned, frame rates from surveillance video can often be variable. Timestamps are timecode-independent.
Proprietary data timestamps can be written into the container, the stream, or within associated files, such as an index file.
Importing Timestamps in FIVE
When working with proprietary data, Amped FIVE can recognize data timestamps within the format. It can extract them to allow that data to be evaluated and used.
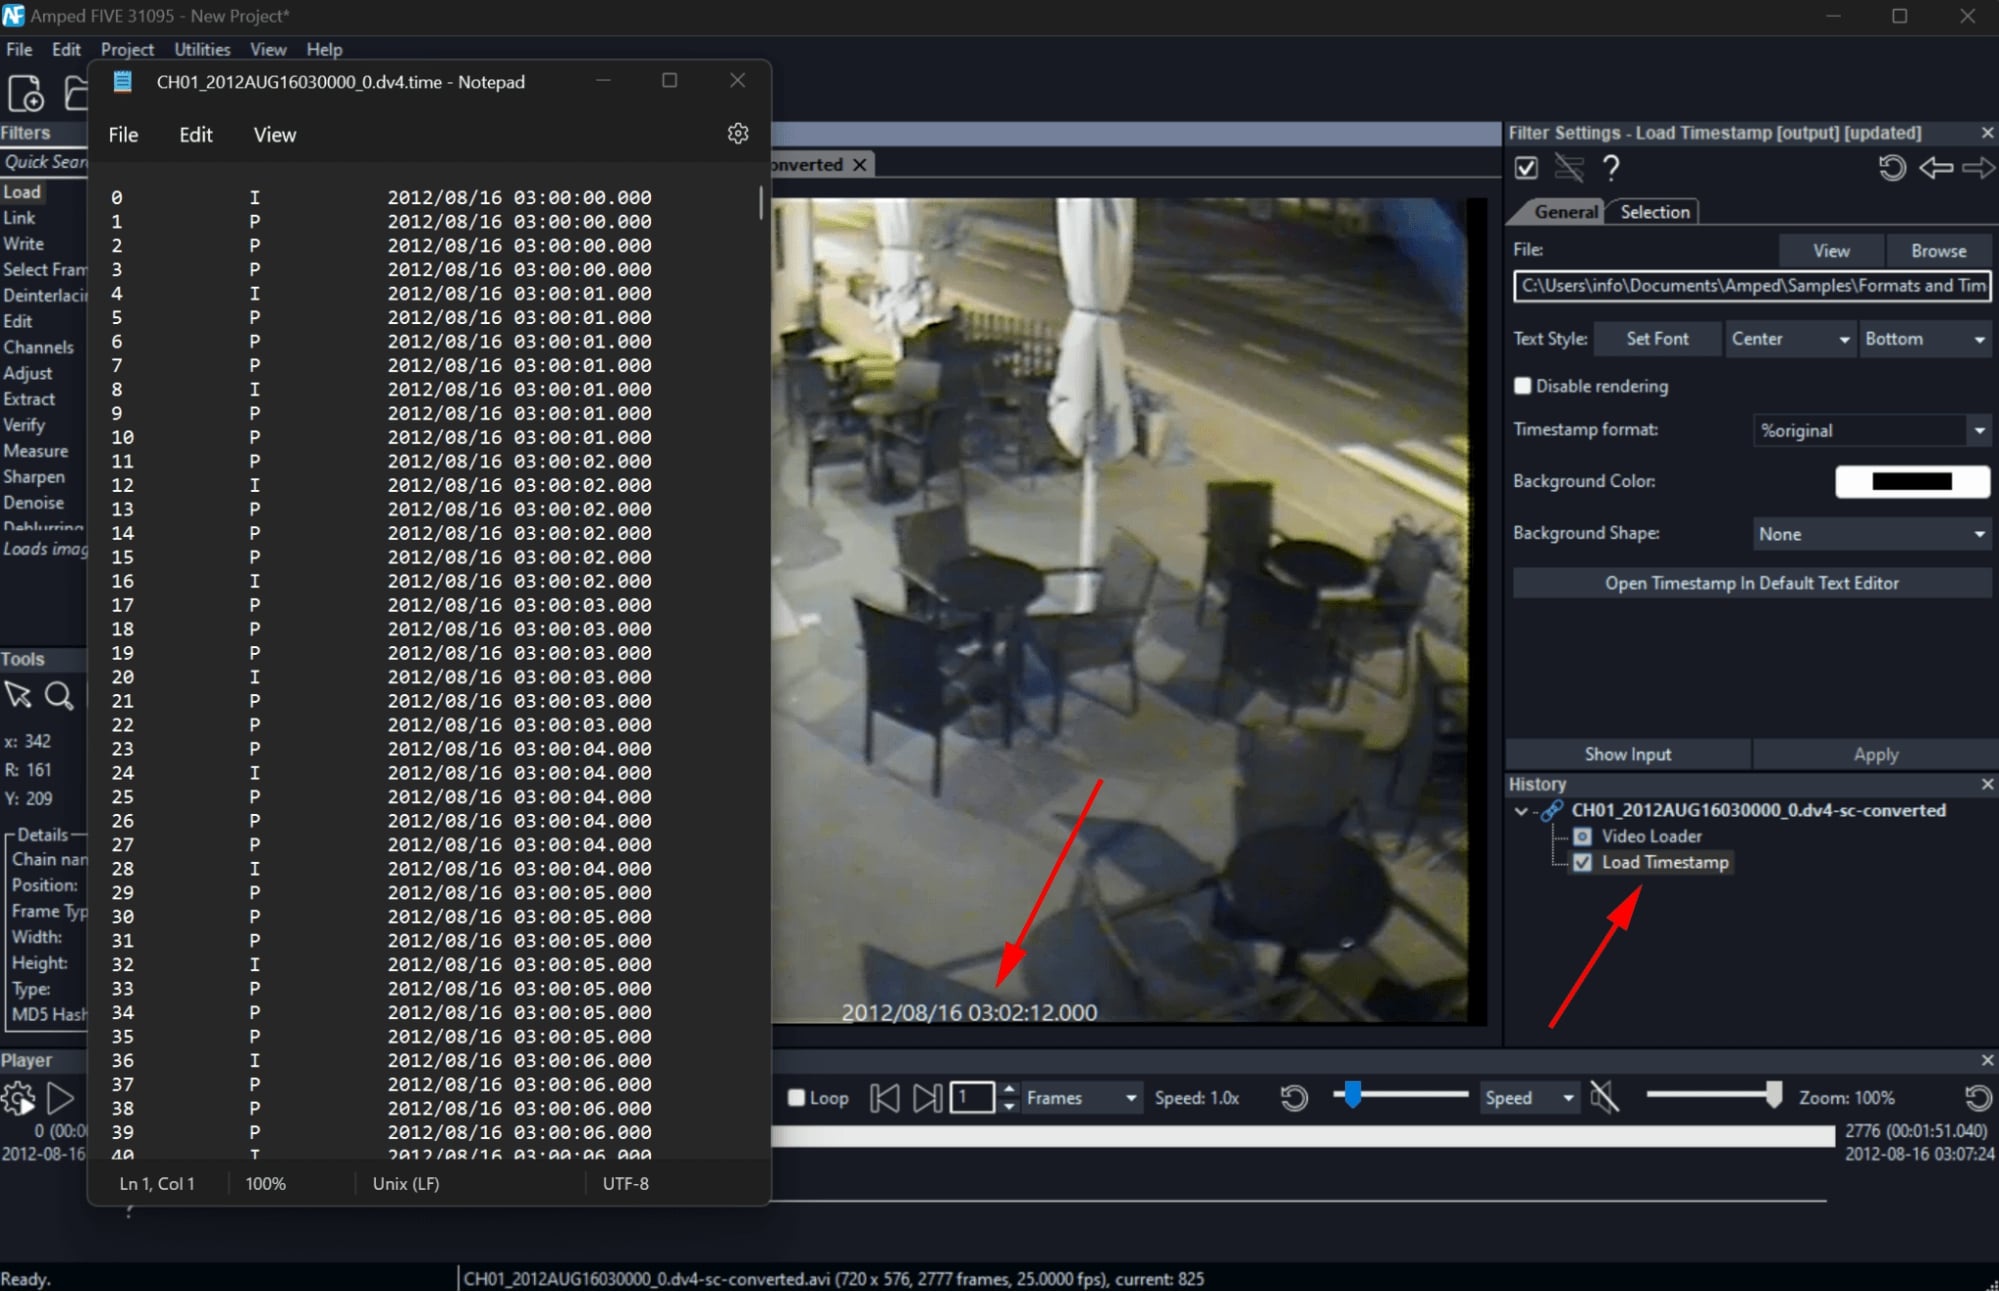
Once we have this data, we can overlay it on the video as an annotation as shown above. More importantly, we can use it to control playback speed regardless of container frame rate or perform timing analysis. In many cases, only certain timestamps are used. They may be duplicated to show the same second for all frames in that second. Or, there may only be a single timestamp for an entire Group of Pictures (GOP). In these cases, you can use the Adjust Timestamp filter to refine and/or interpolate the data.
Presentation Timestamp (PTS)
Before we take a brief look at PTS, the integrity of the video must be intact. If it has been incorrectly acquired or processed before your evaluation, then the timing data may not be authentic. This includes the reformatting of the stream into a different container.
There are two quick ways to assess and view this data within Amped FIVE. The first is using the Advanced File Info Utility and conducting a Frame Analysis.
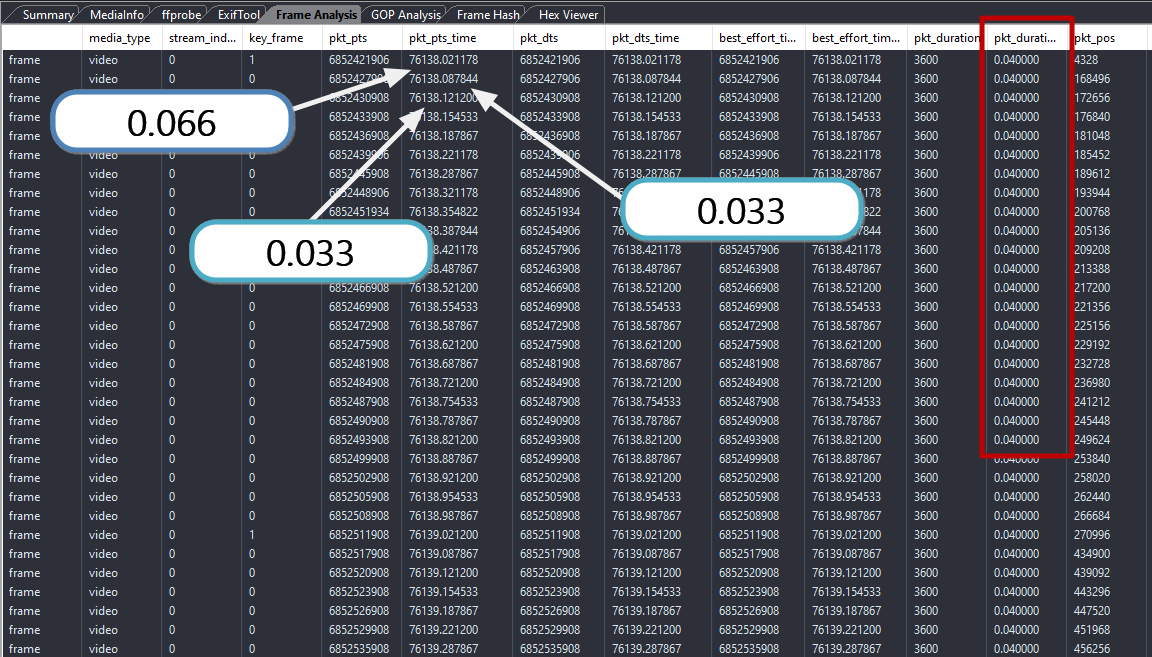
This data is exportable, so it can be used in many ways depending on your requirements. An important consideration is that the stream timing of the video packets could be very different from the duration of each frame.
As can be seen above, the packet duration displays a constant 25 FPS, (0.040 x 25 = 1 second). The true duration of the frames, the difference between their presentation time, is in reality variable.
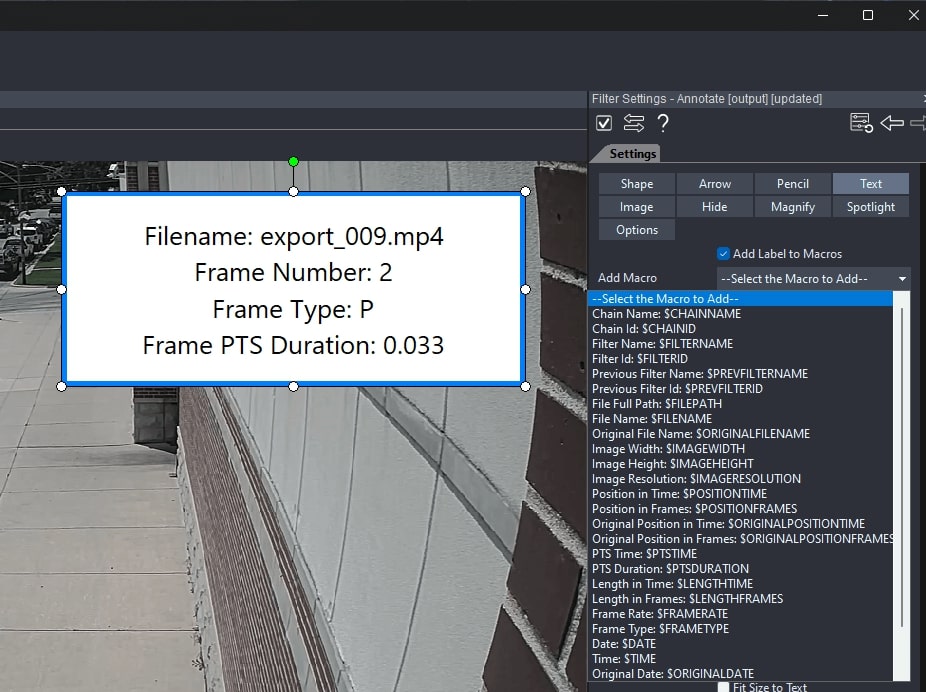
You can easily view and annotate this data onto your video for evaluation or presentation purposes, by using the Add Text or Annotate Text Macros within Amped FIVE.
Finally, and before moving on to the distances. When identifying the reliability of timing data, it is important to have a solid understanding of how the video was created and ensure its integrity. With video data transmission now being much easier, the control of the timing is sometimes lost. Comparing and contrasting all known timing sources is therefore important. When anomalies are found, further scene assessments may be required, including the use of timing boards and performing controlled acquisitions.
Measuring Distances
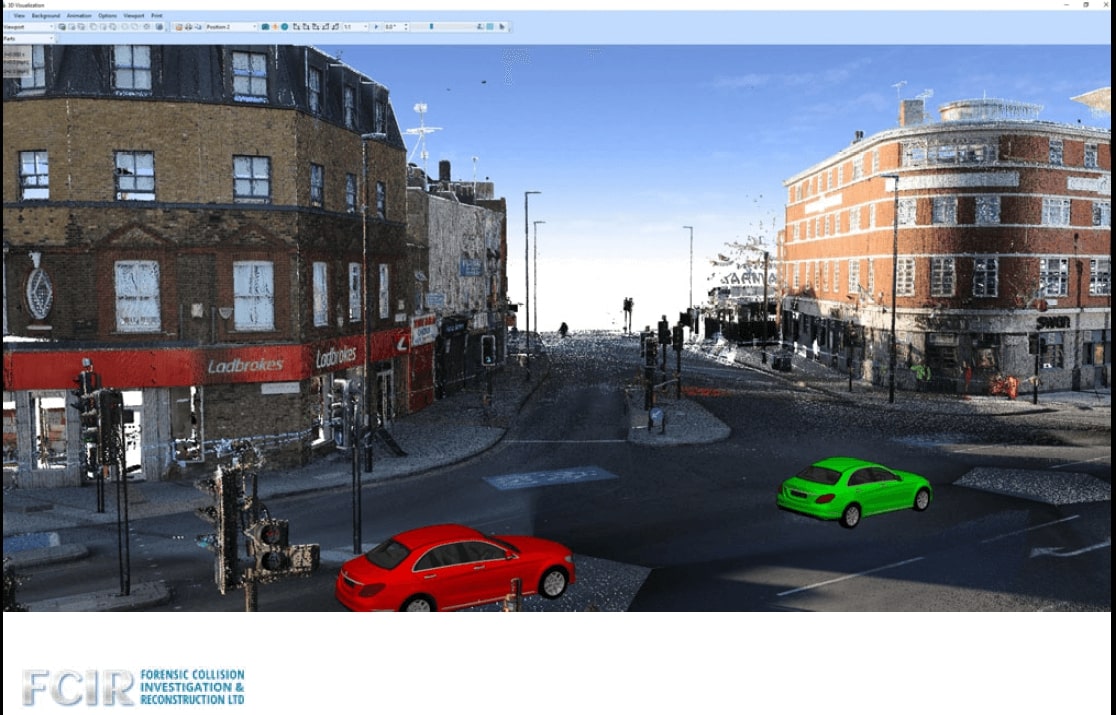
Collision investigators will use different techniques to measure distances in a vehicle’s path, or even between individual frames. Some methods are traditional and may require returning to the scene for measurements. Investigators often use reference objects like lamp posts or road markings, subsequently producing top-down technical drawings to illustrate these measurements. It is also possible to perform a reverse projection, where questioned footage is overlaid on reconstruction footage containing objects with known measurements to be used as spatial references.
More recently, investigators can also benefit from the use of laser scanners. These will project a number of virtual points between landmarks in a scene. Distances in that scene can then be accurately measured with computer software.
The Speed Estimation 2D Filter
As you may imagine, we can also conduct a speed assessment in Amped FIVE by using a dedicated filter from the Measure group. It is called Speed Estimation 2D. The workflow for this filter involves inputting the measurements of a rectangular or square planar object in the scene. Next, the vehicle’s path is drawn in the viewer using a contact point of reference.
The object of reference needs to be on the same planar surface as the traveling object. The contact point also needs to be in the same plane. This will probably have to be a tire’s point of contact with the road. It must be easily identifiable within all the frames we intend to use for our measurements. Let’s say we want to measure the speed of the truck in the video below. The first thing we must do is correct lens distortion (if present). Failing to do so will cause insurmountable errors in your measurements. Please have a look at our previous article on how to correct optical distortion in Amped FIVE. In this instance, we have already corrected the issue.
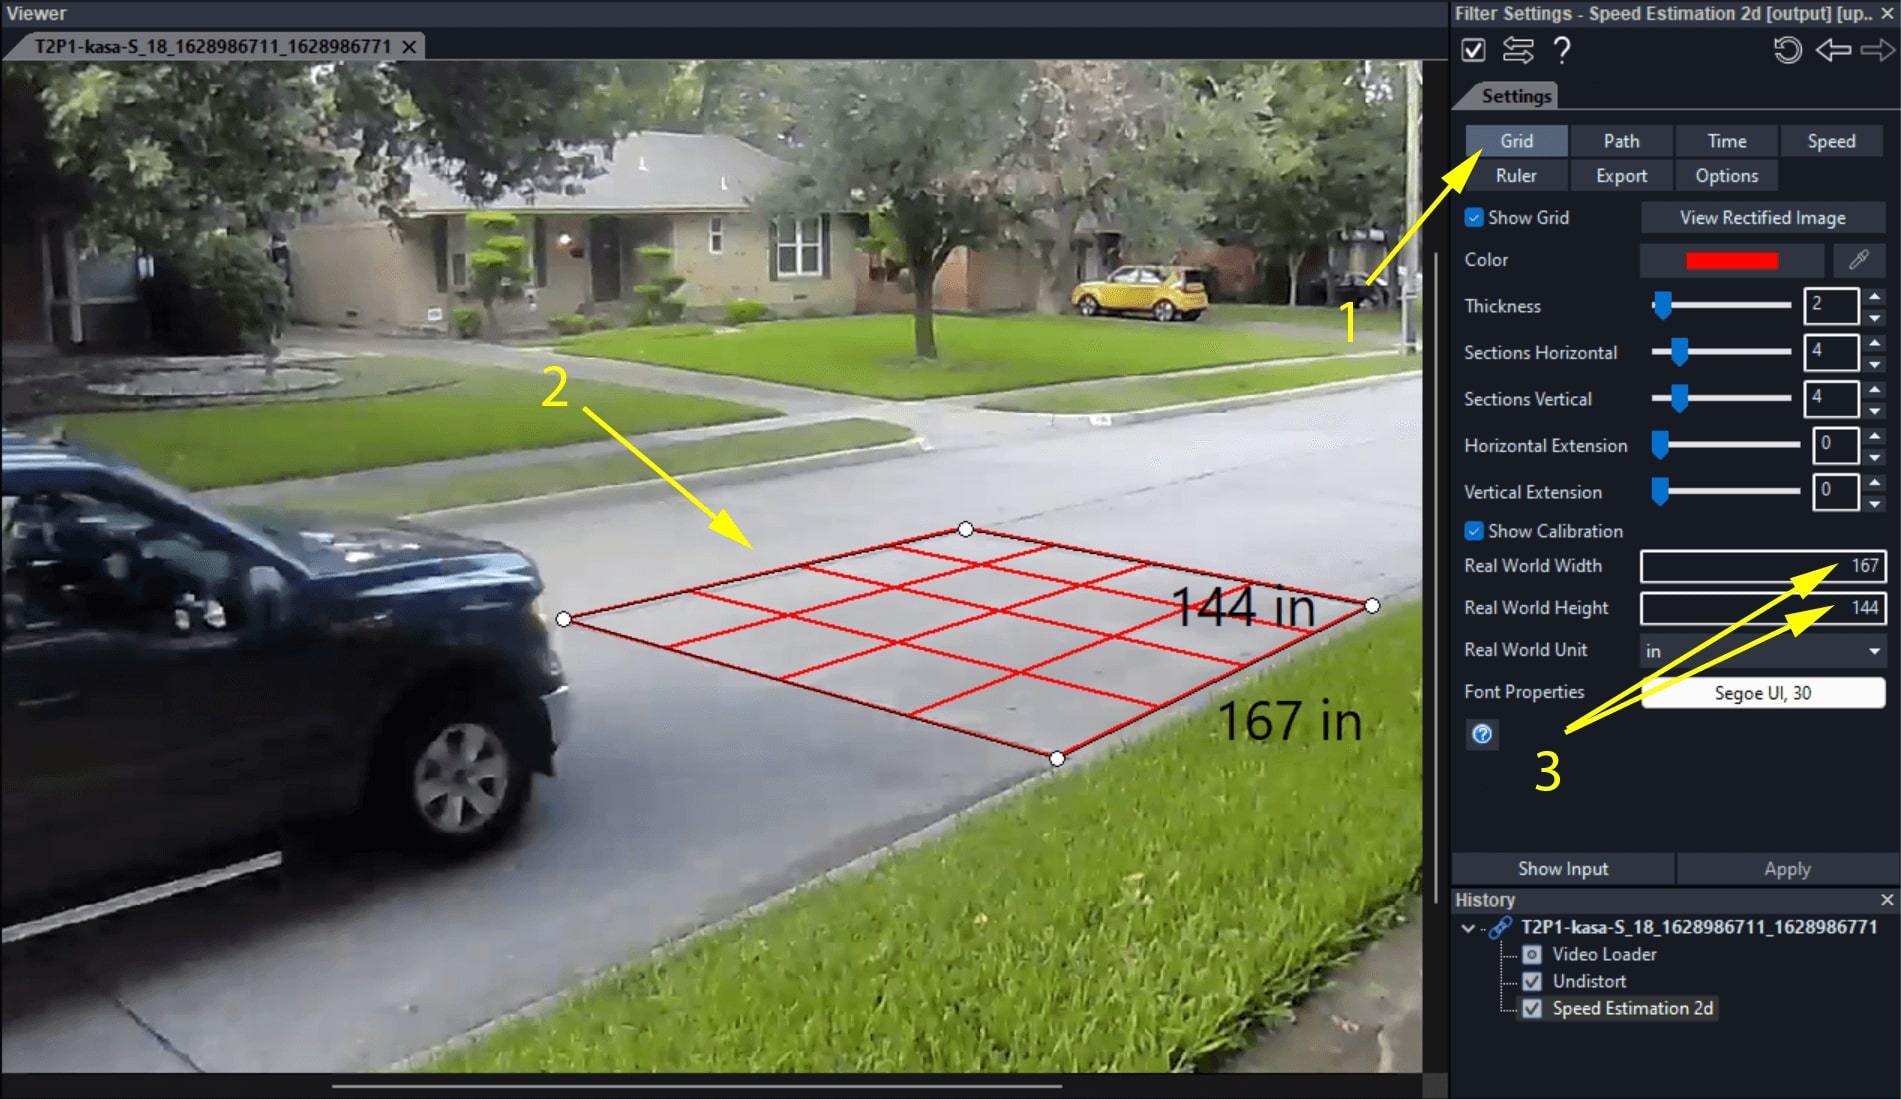
Selecting the Reference Grid
We then applied the Speed Estimation 2D filter into our chain and clicked on the Grid button (1) – the first step of our filter workflow. Then we clicked on the four corners of our object of reference (2), which is a tile on the road. The tile is exactly 167 inches wide and 144 inches high. So we entered these measurements in the appropriate boxes of the filter settings (3), as shown above.
We extended the projection of the reference object onto a wider area of the planar surface. We did this to aid the accuracy of our drawings. This is achieved by increasing the values of the Horizontal Extension and the Vertical Extension parameters in the filter settings. Then, we clicked on the four corners individually. We adjusted their position by holding the mouse button down and moving them as required. When you enter measurements, don’t forget to select the correct Real World Unit from the relevant drop-down box in the filter settings. In this instance, we have selected “in” (inches).
Check out the following webinar to learn more about measuring speed with Speed Estimation 2D filter in Amped FIVE.
Furthermore, to learn more about the full workflow of Speed Estimation 2D in Amped FIVE click here.
Drawing a Path
We then moved along to the next step of the workflow and clicked on the Path button of the filter settings. By using this section of the filter we can draw the path of the vehicle frame by frame, for as many frames as we want a speed estimation for.
In this instance, we have used the vehicle’s front right tire as a contact point (CP) of reference for our path. To do this, simply place your play head at the starting frame of choice for your path. Then click on the contact point and press the “U” button. This will advance the play head by one frame and you can then click on the contact point for the following frame. Because we have entered the measurements of the object of reference in the previous step of the workflow, the filter is already calculating real-world distances between the various contact points in this virtual 3D representation of the scene.
When you click on the ESC button on the keyboard, the path is completed. Then, you can go on and click on the next workflow button in the filter settings.
Pixel Uncertainty
Before you do so, you may also want to adjust the Pixel Uncertainty parameter in the filter settings. This will extend a yellow square around the selected contact point. It is used to calculate the spatial error range in the measurement.
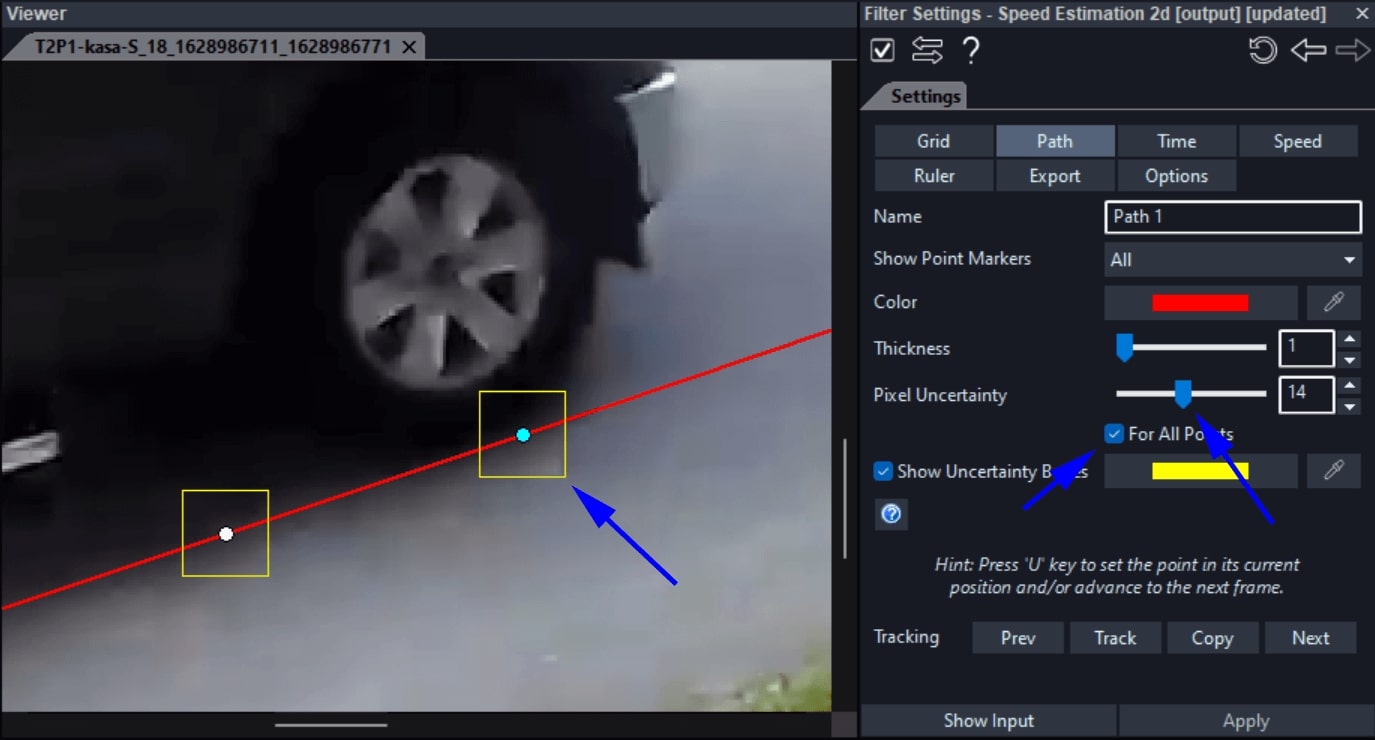
The bigger the size of the square, the bigger the margin of error. Depending on resolution and lighting conditions, it may be difficult to identify the exact pixel location of a contact point. So, extend the size of the square to compensate for visual impediments in locating the exact position of the contact point. You can adjust Pixel Uncertainty for each contact point in your path or adjust them all at once by activating the “For All Points” tick box.
Selecting the Timing Reference
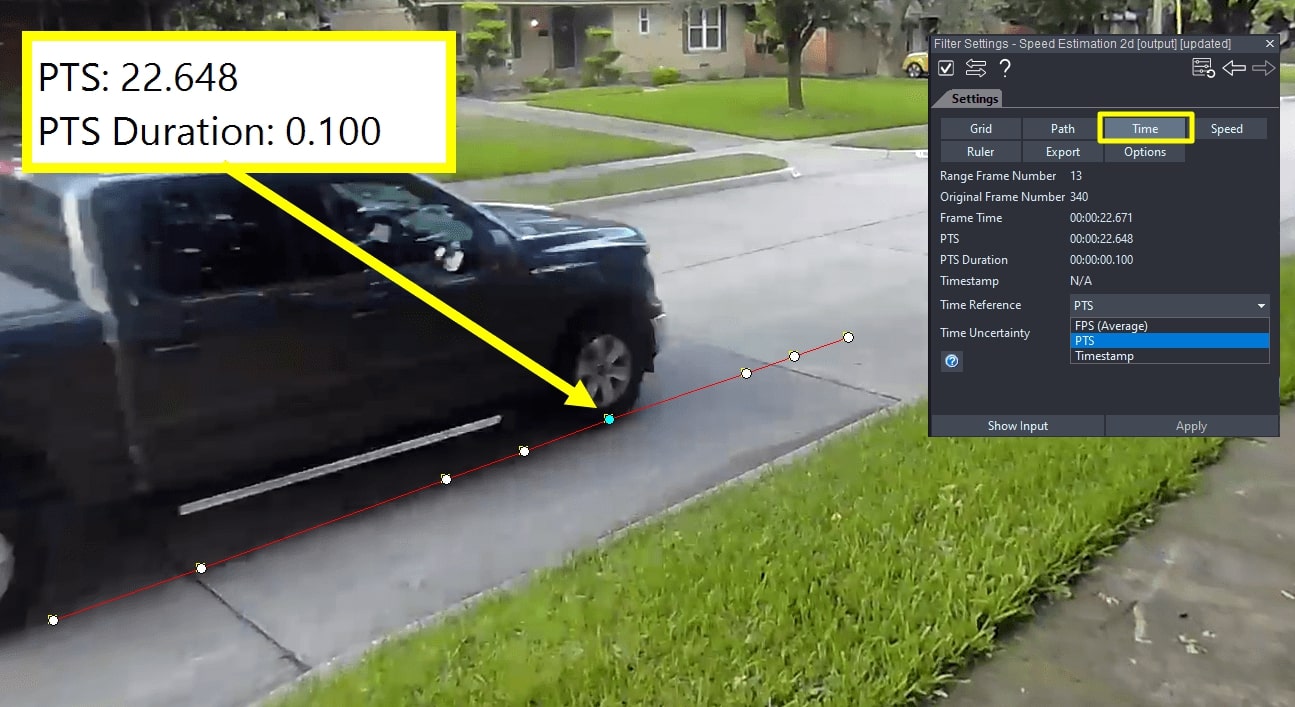
Now that the spatial element of the workflow (along with relevant uncertainties) has been taken care of, we will move on to the next stage of our workflow and click on the Time button of the filter settings.
Here we can select the timing reference that will be used for the final speed assessment, based upon our evaluation of the timing data available.
In this instance, we are satisfied with the integrity and have analyzed the PTS data using Advanced File Info. By presenting the data as a text overlay, we can quickly identify a variable cycle of frame durations, consisting of one longer frame (0.10s), followed by two shorter frames (0.05s). We can compare and contrast this with the displacement of the vehicle.
Putting the Numbers Together
We now have everything in place to obtain a speed calculation. All we have to do is click on the Speed button of the filter and then click on the New Measurement button.
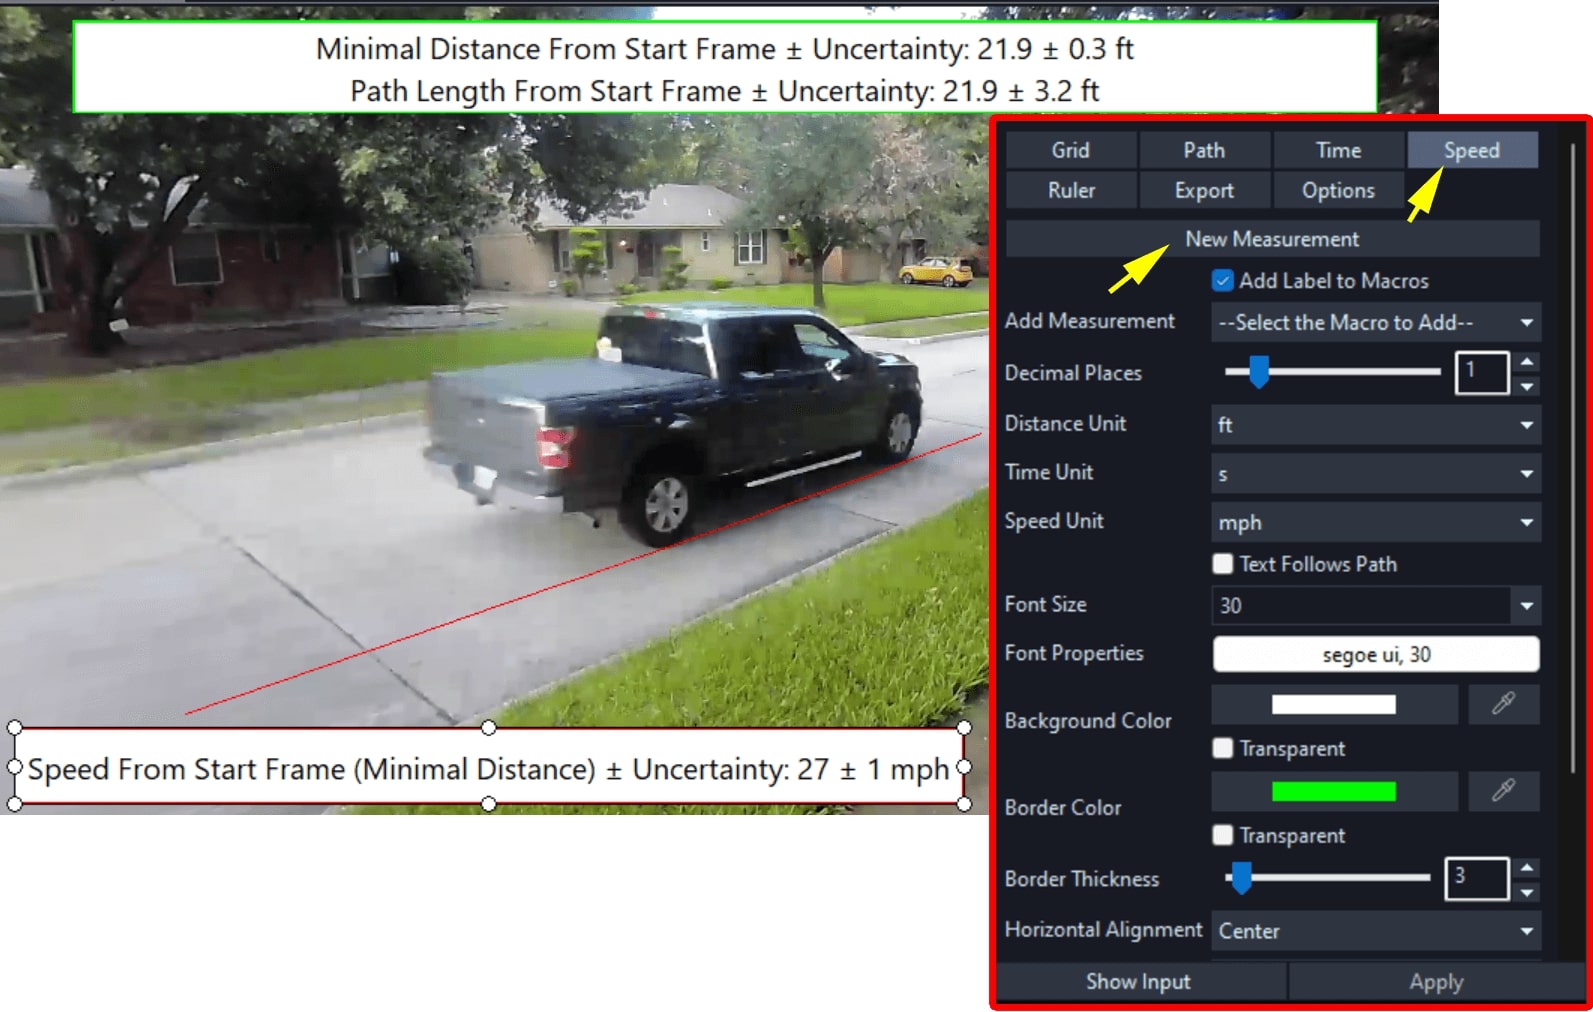
This will add an annotation to your video containing preset text labels and macro data as annotations. All the available data sets are available from the Add Measurement drop-down box. The list of measurements is extensive but the most common will be the “Speed from Start Frame”, the “Path Length” etc. In this instance, we have an approximate calculated speed of 27mph, with a 1mph error range. This means that, according to our calculations and the spatial and time uncertainties we have set, the vehicle could also be traveling at 26 mph and 28 mph.
Notice that we used the Minimal Distance estimation, which computes the average speed from the first to the last point of the path. This was possible since we could see the vehicle traveling in a straight line. If the vehicle is turning, you should rather use the Path Length macro, which takes into account all the selected points. This typically leads to a wider uncertainty range.
It is important to understand that, as an analyst, it is also your responsibility to account for errors in your measurements. The Speed Estimation 2D filter will help you do that as well, as we have just seen.
Depending on what we want to measure in Amped FIVE, there’s a variety of different filters we can choose from in the Measurement group. You may also want to look at this post on what filters to use in Amped FIVE when measuring a scene.
Conclusions
This concludes our discussions on speed estimation and how to estimate speed from surveillance video in Amped FIVE.
Remember that your evidence will be all the more robust if you also use different methods to validate your exercise in FIVE. A reconstruction is always recommended to measure objects of reference directly at the scene. And of course, reverse projection and laser scans, previously discussed, will also help with validation. This is it for this week. Don’t forget to tune in again next week for our very last article in this series. Until then, colleagues, stay safe and take care.