
Hello everyone and welcome to a new article in our “Learn and solve it with Amped FIVE” series. We hope you are enjoying this series, dedicated to solve common challenges related to video evidence using Amped FIVE. This week we are going to discuss the issue of uneven illumination in a scene. This may prevent us from discerning detail. One common example of such an issue is backlighting. This occurs when we have an object or subject of interest located between a light source and the camera lens. Let’s go and find out together how we can enhance a backlit scene.
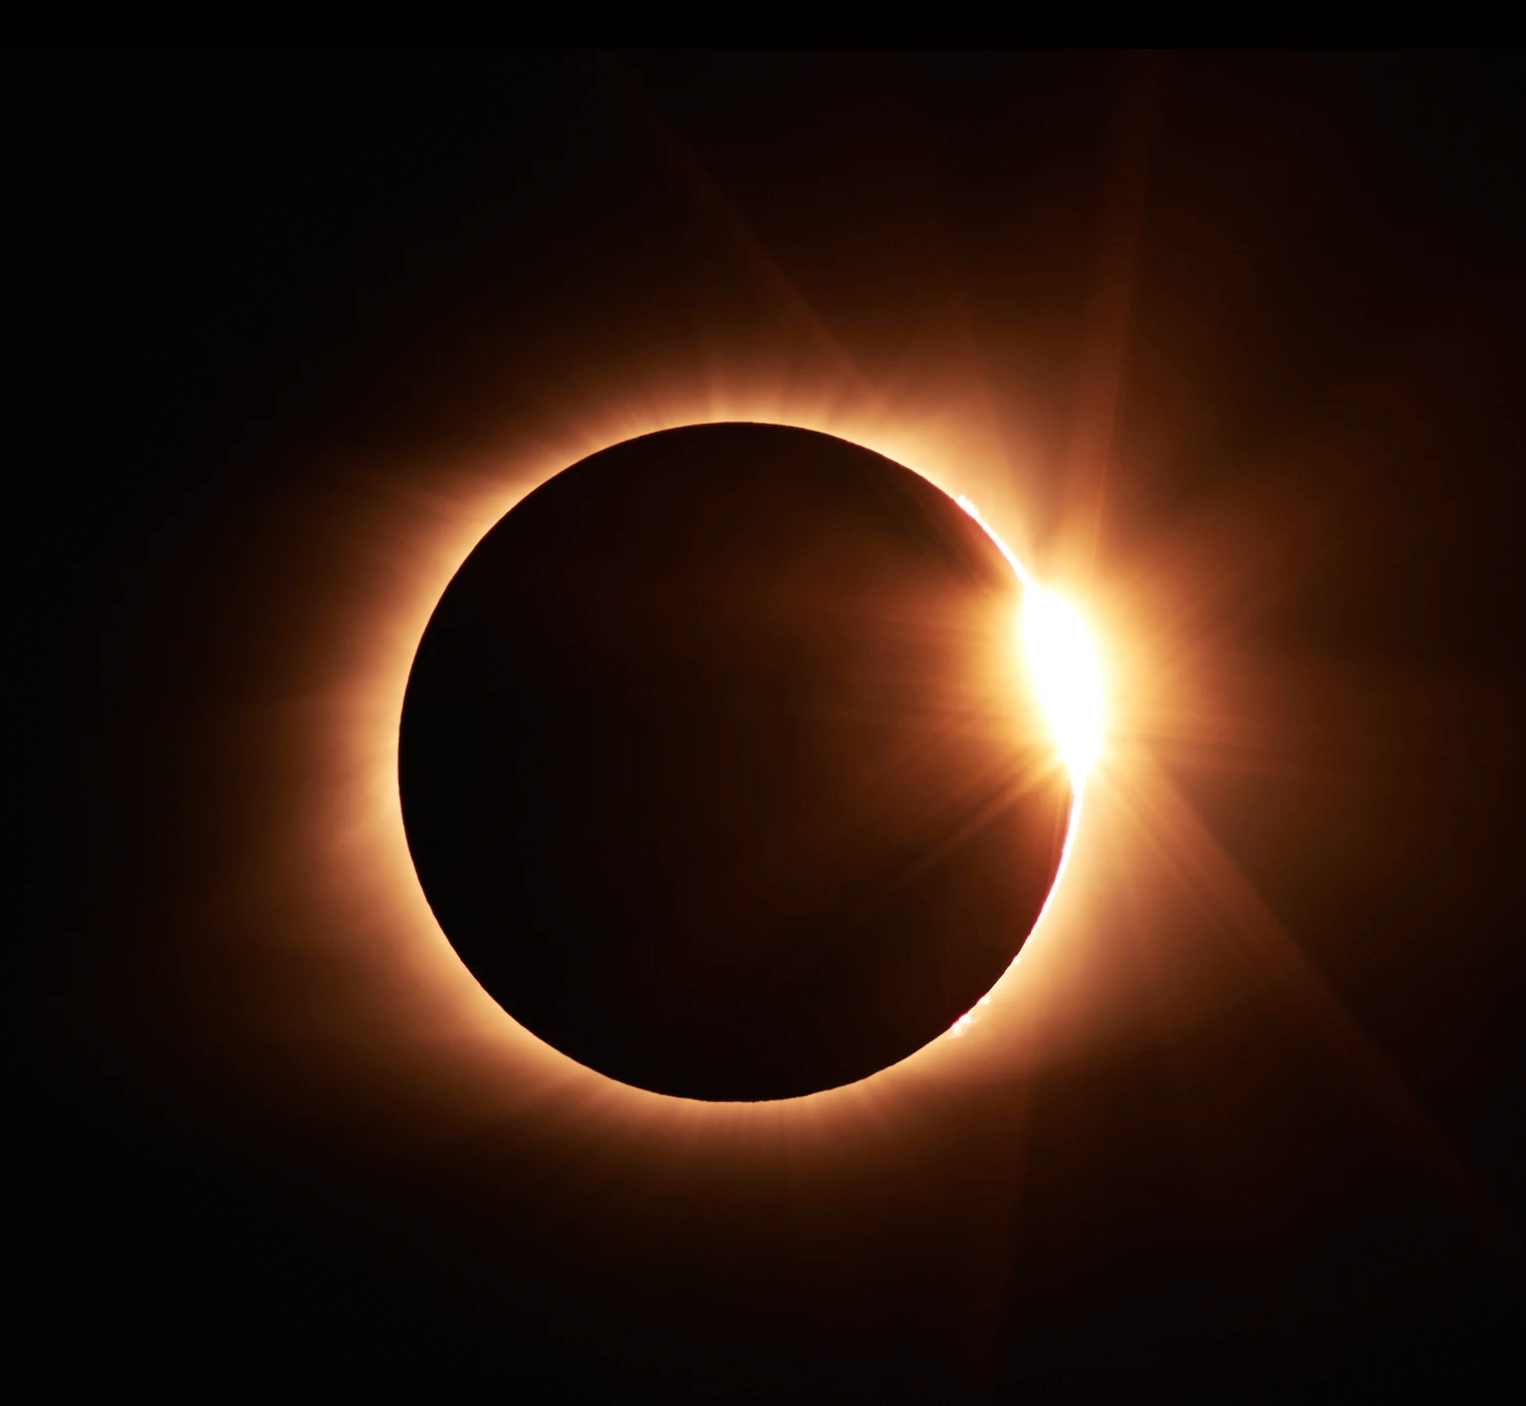
Think of a solar eclipse (as rare as that may be!). The moon is between you and the sun (the light source). The daylight will turn into darkness. But you will still see a faint halo of illumination around the edges of the moon. You will not be able to see any craters on the moon. This is because the light source is coming from the opposite side relative to your location.
Challenges of a Backlit Scene
In images, the issue with such a scenario is that, notwithstanding a fair overall amount of illumination, the scene (or an object/subject of interest) will be generally dark. This is due to an obstacle of considerable size located between the light source and the camera.
However, if the light source is not entirely obscured, it may still provide that little amount of illumination required to discern detail on the “dark side” of our subject or object of interest. Let’s carry on some preliminary analysis to assess our chances of success.
The Histogram
Whenever we deal with changing luminance and/or color values of pixels, it is good practice to have a look at the histogram. This is a graphical representation of the distribution of pixel values in an image. In the commonly used 8-bit depth range of a digital image (or video), 256 values are used to represent changes in luminance and/or in the primary Red, Green and Blue (RGB) channels. Why 256? Because 2 at the power of 8 (bit depth) equals 256.
In such systems, 0 is the minimum value of luminance and/or color i.e. pure black. 255 is the maximum value i.e. pure white. Within these, there lie 254 intermediate values. These indicate the gradual presence (or lack) of luminance and/or color in an image. As values vary within this range, so does the contrast of detail.
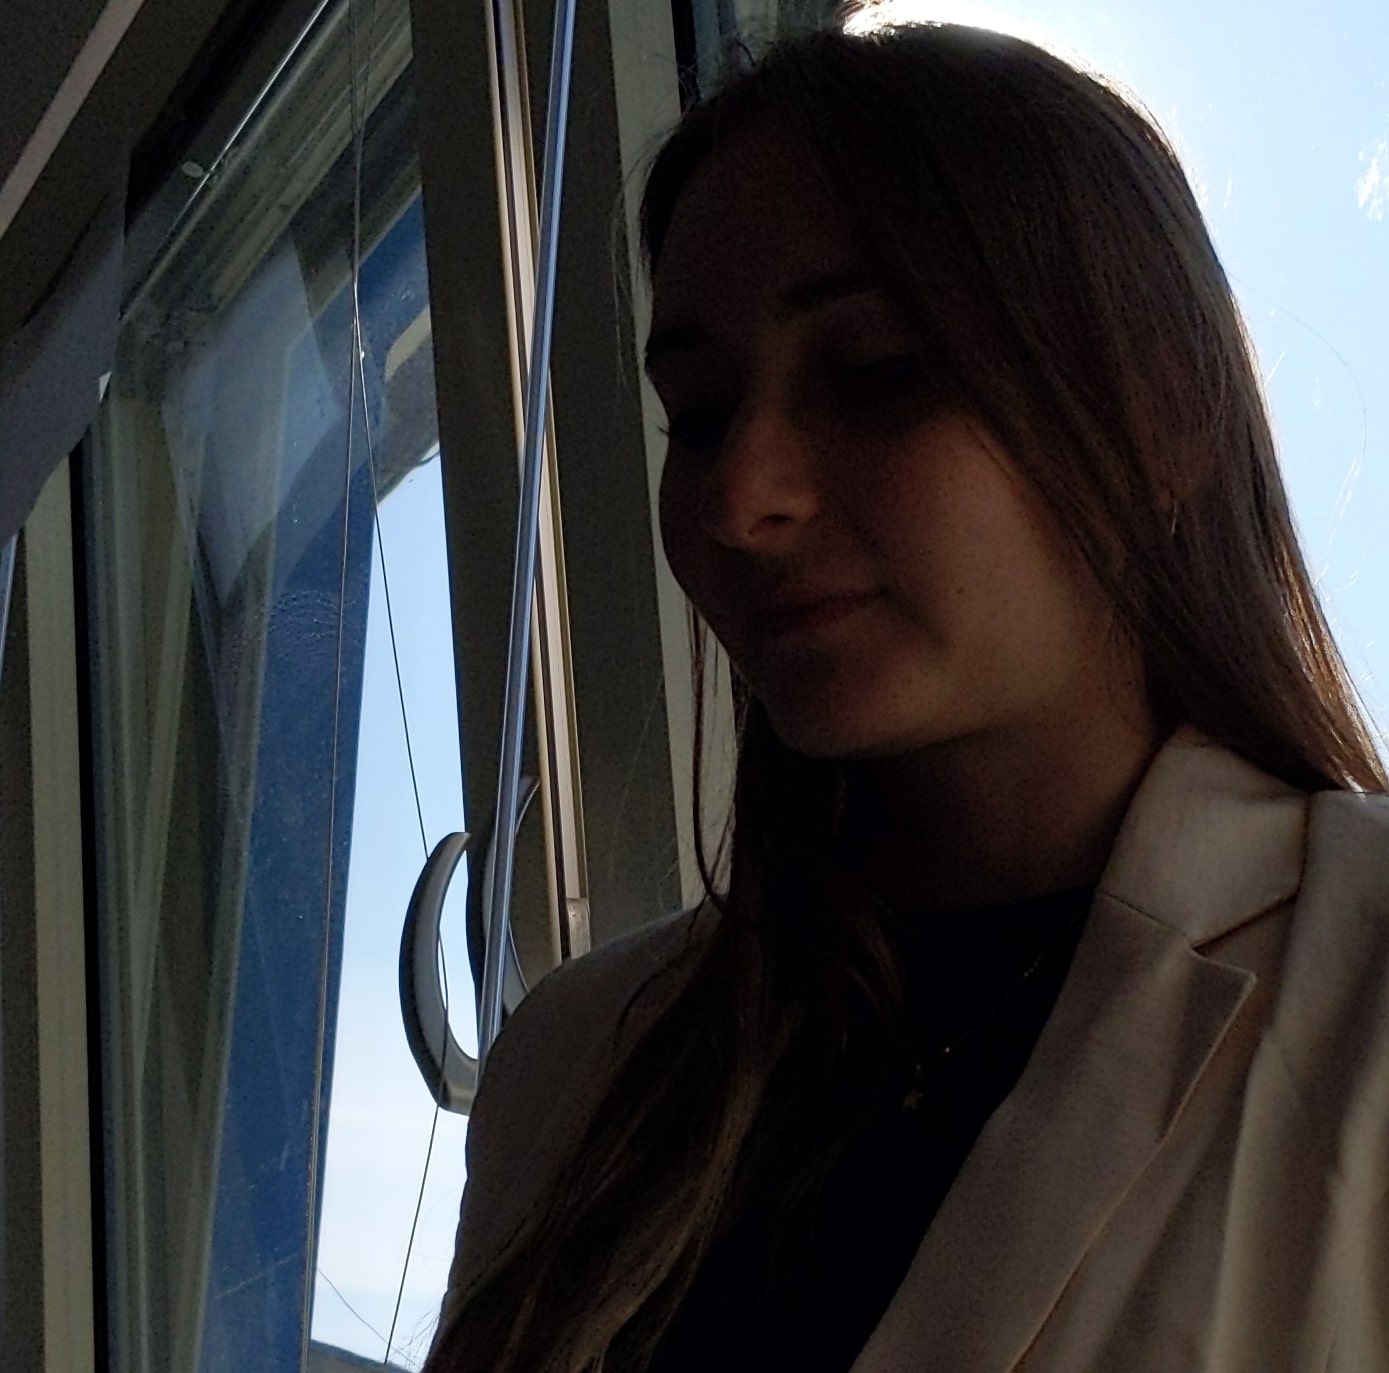
Let’s have a look at the Histogram depicting the above image of the lady’s silhouette. This will give us a better understanding of the distribution of its pixel values.
Analyzing the Histogram
When you have an image loaded, you will see the histogram populated by graphical data. The horizontal axis of the histogram shows you the pixel values ranging from 0 (black) to 255 (white). The vertical axis shows you the distribution of pixels in the whole image for a specific value.
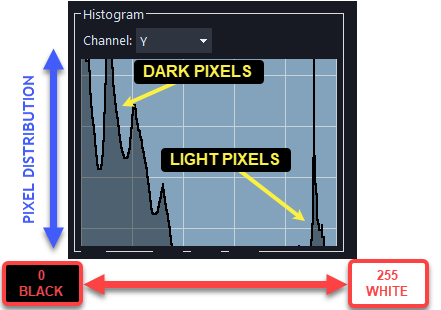
In this instance, we are monitoring only the luminance (the Y channel). We can see that the majority of pixels in the image are dark with some mid-to-dark values and a very small amount of light and white pixels just visible as a little spike on the right side of the histogram. This little spike gives us a quantifiable account of the small areas of very bright pixels visible on the sky behind the lady. The majority of the image is dark, as confirmed by our histogram. Note, however, that the histogram does not tell us where these dark or light pixels are geographically located in the image, only their values and their proportional distribution in the whole image.
The whole idea behind the histogram is that it will tell us how much variation of pixel values we have, regardless of how dark or light they are. In this instance, we have a healthy variation in the dark region of the histogram that we can stretch out to improve the overall visibility of detail in the scene. In essence, we will brighten up the brighter pixels (that are currently not very bright at all) to white or near white and everything else, in a controlled manner.
The Smart Adjust Filter
In normal circumstances, we would use a filter from the Adjust group in Amped FIVE to change the pixel values in an image, such as the Levels or the Histogram Equalization filters, for example. These would be ideal for making a dark image brighter, a bright image darker and to equalize a gray image (a foggy scene, for example). Remember, we can only do so if we have a healthy variation of pixel values.
In this instance, however, we are dealing with a situation where there is uneven illumination. We already have dark, gray and light pixels somewhere in the image. They are just not evenly distributed.
Filter Application
Let’s go and apply the Smart Adjust filter from the Adjust group and change the mode to Brighten. We will immediately notice how pixel values have been equalized evenly in the image. The filter is essentially estimating the local minimum and maximum pixel values at each point of the image. It will then stretch the input intensity values, so that the local minimum becomes black and the local maximum becomes white. By doing so, it is also preventing saturation of the bright pixels. Now we have a much better contrast of detail in the lady’s face but the remainder of the image is not excessively bright, in proportion.
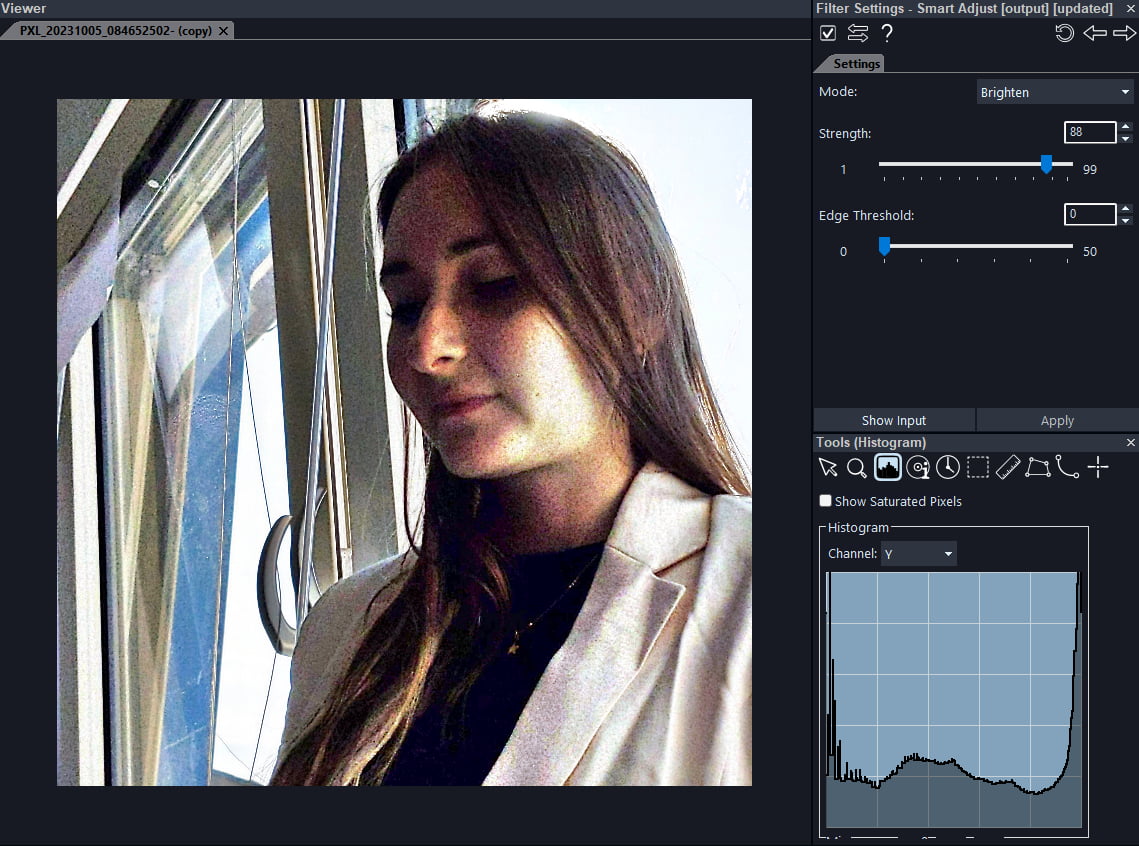
Look how the pixel values are now evenly distributed in the histogram with values readily available between the minimum 0 and the maximum 255.
There are also other filters which do a similar job (to name a few: Retinex, Homomorphic Filter and CLAHE). However, the Smart Adjust filter has been designed specifically to reduce the formation of halos around the sharp edges of the image. These are artifacts inevitably generated by these types of filters when evening out the illumination in an image.
It is also possible to customize the filter by choosing the appropriate equalization mode in the relevant drop-down menu (“Darken”, “Brighten” and “Equalization” modes are all available) and by setting the strength and the edge-preserving property of the filter.
Conclusions
When finished, have another look at the histogram but tick the Show Saturated Pixels option in the Histogram tool. This will add an overlay in the viewer in order to show you the saturated pixels i.e. the pixels that have been pushed below the minimum of 0 and the maximum of 255. The pixels below the minimum will be rendered in blue and the pixels above the maximum will be rendered in red.
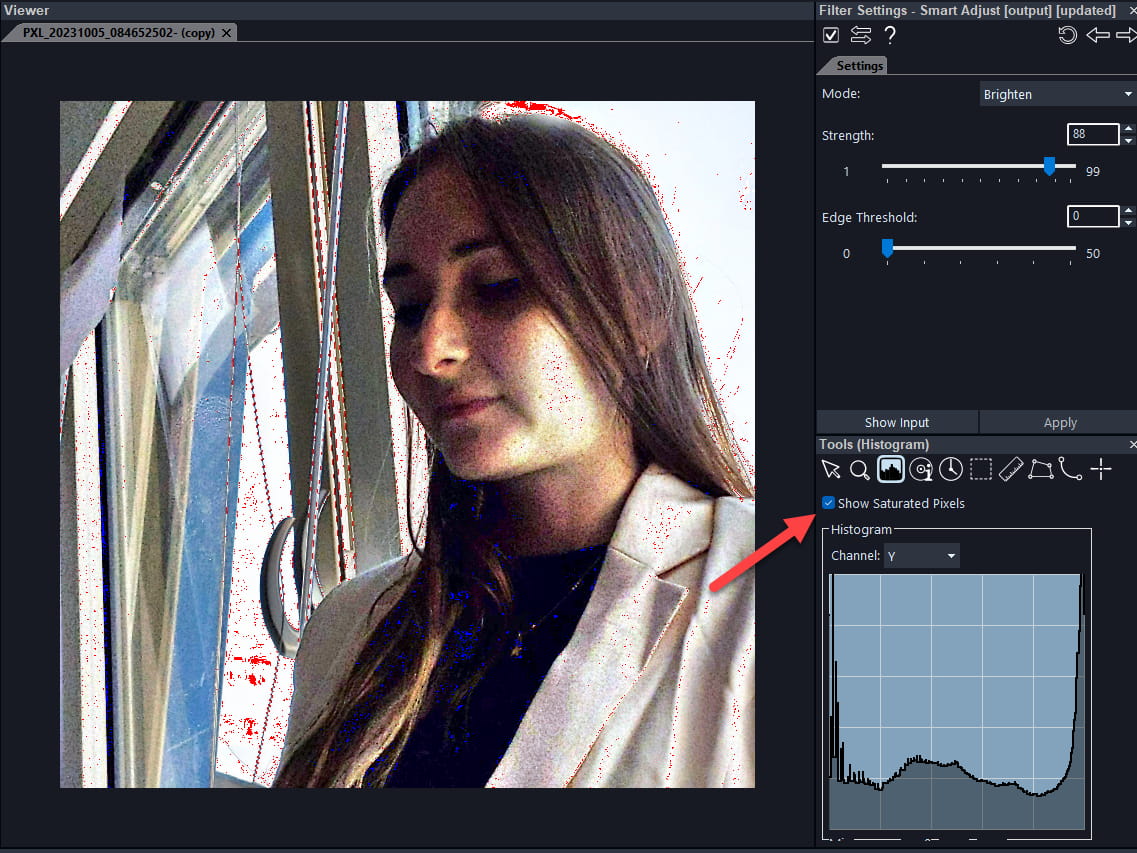
In this instance by applying the Smart Adjust filter, we have slightly pushed some pixel values below the minimum of 0 and above the maximum of 255 (shown as blue and red, respectively, in the image above). Overall, we have not lost any variation of detail in the face of our subject. And so we have reached a more than acceptable compromise.
And that’s it for this week! Don’t forget to tune again to our blog next Tuesday. We will discuss the issue of deblurring a license plate in an image. Till then folks, have a great week!