We tested the latest implementation (Build 8782) of PRNU-based Camera Identification and Tampering Localization on a “base dataset” of 10.069 images, coming from 29 devices (listed in the table below). We split the dataset in two:
– Reference set: 1450 images (50 per device) were used for CRP estimation
– Test set: 8619 images were used for testing. On average, each device was tested against approximately 150 matching images and approximately 150 non-matching images.
It is important to understand that, in most cases, we could not control the image creation process. This means that images may have been captured using digital zoom or at resolutions different than the default one, which makes PRNU analysis ineffective. Making use of EXIF metadata, we could filter out these images from the Reference set. However, we chose not to filter out such images from the Test set: we prefer showing results that are closer to real-world cases, rather than tricking the dataset to obtain 100% performance.
Using the above base dataset, we carried out several experiments:
– Experiment 1) testing the system on images “as they are”
– Experiment 2) camera identification in presence or rotation, resize and JPEG re-compression
– Experiment 3) camera identification in presence of cropping, rotation and JPEG re-compression
– Experiment 4) discriminating devices of the same model
– Experiment 5) investigating the impact of the number of images used for CRP computation.
Test results are shown using Receiver Operating Characteristic (ROC) curves and their Area Under the Curve (AUC). If you’re not familiar with ROC and AUC, you may want to take a look here.
Table 1: complete list of devices in the dataset. By clicking on device name, you will be sent to the corresponding page on DPreview.com
| Make | Model | Type | Release year | Resolution | |
| Apple | iPhone 4 | Phone | 2011 | 5MP | |
| BenQ | DC4330 | Compact | ? | 3MP | |
| Canon | Powershot A75 | Compact | 2004 | 3MP | |
| Canon | Powershot s2is | Compact | 2005 | 5MP | |
| Canon | Powershot SD630 | Compact | 2006 | 6MP | |
| Canon | IXIUS v2 | Compact | 2002 | 2MP | |
| Casio | Exilim ex-z60 | Compact | 2006 | 6MP | |
| Casio | Exilim ex-z75 | Compact | 2007 | 7MP | |
| Casio | Exilim ex-z70 | Compact | 2006 | 7MP | |
| DigCam | Sub-6MP | Compact | ? | ||
| Fujifilm | Finepix A350 | Compact | 2005 | 5MP | |
| HP | Photosmart 320 | Compact | 2002 | 2MP | |
| Nikon | e-coolpix-s570 | Compact | 2009 | 12MP | |
| Nikon | D70 | DSLR | 2004 | 6MP | |
| Nikon | D80 | DSLR | 2006 | 10MP | |
| Nikon | D100 | DSLR | 2002 | 6MP | |
| Nikon | D300 | DSLR | 2007 | 12MP | |
| Nikon | e2500 (Coolpix 950) | Compact | 1999 | 2MP | |
| Nikon | e885 (Coolpix 885) | Compact | 2001 | 3MP | |
| Nikon | E7900 (Coolpix 7900) | Compact | 2005 | 7MP | |
| Nikon | E880 (Coolpix 880) | Compact | 2000 | 3MP | |
| Nokia | n95 | Phone | 2007 | 5MP | |
| Olympus | u760 | Compact | 2007 | 7MP | |
| Olympus | E300 | DSLR | 2004 | 8MP | |
| Panasonic | Lumix dmc-tz3 | Compact | 2007 | 7MP | |
| Panasonic | Lumix dmc-fs15 | Compact | 2009 | 12MP | |
| Pentax | Optios | Compact | 2003 | 3MP | |
| Premier | DC-3320 | Compact | 2001 | 3MP | |
| Sony | Cybershot | Compact | ? | 2MP | |
Experiment 1: source device identification on the base dataset
Using the Base dataset, we ran experiments and stored the obtained PCE value for each matching case (that means, comparing an image to the CRP of its originating device) and each non-matching case (we were comparing an image to the CRP of a different device). Figure 1 shows how PCE values are distributed for the non-matching cases and matching cases. We see that PCE values are higher than 100 in most matching cases, while they spread in a seemingly exponentially decreasing way between 0 and 25.
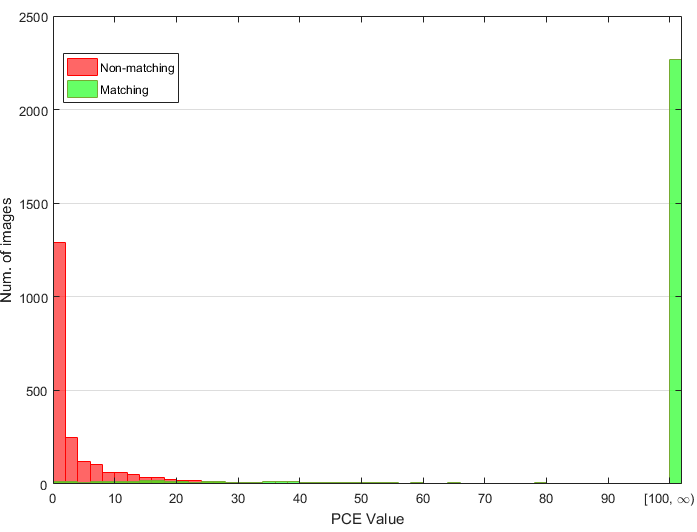
Figure 1: histogram of PCE value for matching cases (red bars) and mismatching cases (green bars)
Intuitively, what we need to do is to set a threshold for the PCE value. Then, when comparing an evidence image to the CRP that supposedly generated it, we’ll compare the obtained PCE against the threshold: if it’s above the threshold, we’ll say the image is compatible with the device, otherwise not. Using our experimental data, we can decide where to set the threshold. Choosing too low values will result in “compatible!” quite often, so we’ll have many true positives (which means that a matching image is correctly classified as matching), but we’ll also have many false positives (non-matching images erroneously classified as matching). Choosing too high values would bring the opposite problem: we’d remove many false positives, but we’d also lose many true positives. This is where the ROC curve comes in handy. We let the threshold span a large set of possible values and annotate the true positive and false positive rate associated with each value. Then, we consider false positive rate versus true positive rate for each threshold value, as in Figure 2. We see that for a threshold value of 26, the classification algorithm yields 94% true positive rate for 0.1% false positive rate. Keeping in mind that the Test dataset contains images that may have been zoomed, this result is undoubtedly positive overall.
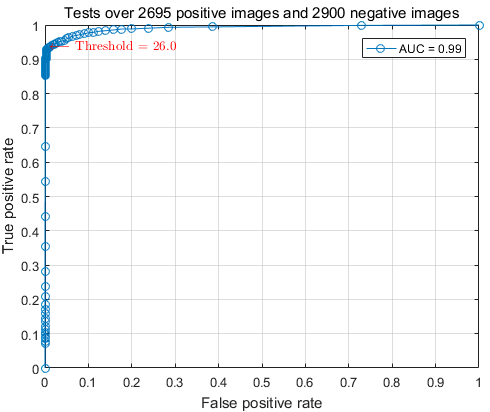
Figure 2: ROC curve for the base dataset
Table 2 shows the performance achieved by the system on each device, using 26 as the threshold. We notice that the Panasonic Lumix DMC-TZ 3, together with the Nikon Coolpix S 570 and the outdated Premier DC-3320 devices are the most critical to the system (true positive rate below 90%). For other devices, however, performance is greatly appreciable. Noticeably, on our Test dataset, the true negative rate never gets lower than 97%, and it is 100% for 17 devices.
| Make | Model | Source identification performance |
| Apple | iPhone 4 | 99% (TP: 98 | TN: 100) |
| BenQ | DC4330 | 99.5% (TP: 100 | TN: 99) |
| Canon | Powershot A75 | 98% (TP: 98 | TN: 98) |
| Canon | Powershot s2is | 100% (TP: 100 | TN: 100) |
| Canon | Powershot SD630 | 99% (TP: 100 | TN: 98) |
| Canon | IXIUS v2 | 100% (TP: 100 | TN: 100) |
| Casio | Exilim ex-z60 | 90.9% (TP: 82 | TN: 100) |
| Casio | Exilim ex-z75 | 93% (TP: 91 | TN: 95) |
| Casio | Exilim ex-z70 | 95.9% (TP: 92 | TN: 100) |
| DigiCam | Sub-6MP | 97.0% (TP: 95 | TN: 99) |
| Fujifilm | Finepix A350 | 100% (TP: 100 | TN: 100) |
| HP | Photosmart 320 | 99.5% (TP: 99 | TN: 100) |
| Nikon | e-coolpix-s570 | 84.3% (TP: 69 | TN: 100) |
| Nikon | D70 | 99.5% (TP: 100 | TN: 99) |
| Nikon | D80 | 99.5% (TP: 99 | TN: 100) |
| Nikon | D100 | 99.0% (TP: 100 | TN: 98) |
| Nikon | D300 | 100.0% (TP: 100 | TN: 100) |
| Nikon | e2500 (Coolpix 950) | 97.0% (TP: 94 | TN: 100) |
| Nikon | e885 (Coolpix 885) | 98.0% (TP: 96 | TN: 100) |
| Nikon | E7900 (Coolpix 7900) | 98.5% (TP: 100 | TN: 97) |
| Nikon | E880 (Coolpix 880) | 98.5% (TP: 100 | TN: 97) |
| Nokia | n95 | 100.0% (TP: 100 | TN: 100) |
| Olympus | u760 | 98.0% (TP: 98 | TN: 98) |
| Olympus | E300 | 97.0% (TP: 100 | TN: 94) |
| Panasonic | Lumix dmc-tz3 | 76.8% (TP: 54 | TN: 100) |
| Panasonic | Lumix dmc-fs15 | 92.4% (TP: 87 | TN: 98) |
| Pentax | Optios | 100% (TP: 100 | TN: 100) |
| Premier | DC-3320 | 84.8% (TP: 70 | TN: 100) |
| Sony | Cybershot | 100% (TP: 100 | TN: 100) |
Table 2: device specific source identification performance
Experiment 2: camera identification in presence or rotation, resize and JPEG re-compression
In this experiment, images are processed and saved as JPEG before entering the source identification algorithm. Processing includes a combination of resize, rotation and lossy JPEG compression. The parameters characterizing each operation are shown in the following table.
| Processing | Parameters |
| Resizing | Bilinear algorithm, resize ratio randomly sampled between 50% and 150% |
| Rotation | Randomly chosen between 90, 180, 270 degrees |
| JPEG compression | Randomly chosen between [60, 70, 80, 90, 100] (standard JPEG quality) |
The overall performance is shown in Figure 3: while there is a sensible loss in terms of true positive rate compared to test on the Base dataset, the source identification system is still reliable, with an AUC of 0.94, and a true positive rate over 80% when allowing only 1% of false positive rate. If we stick to the same threshold for the previous experiment (26), the system yields 81.5% true positive rate for a 0.2% false positive rate.
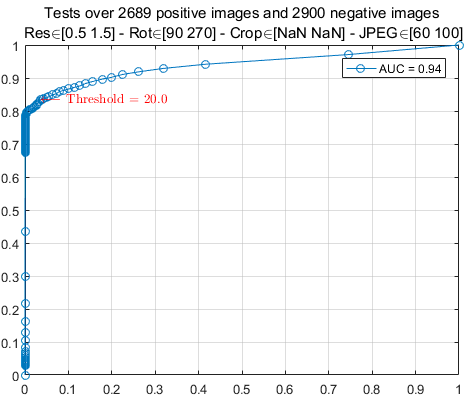
Figure 3: source identification performance in presence of resize, rotation and re-compression
In order to understand the impact of each processing, we first restrict the analysis to those images that did not undergo any resize. Results are in Figure 4. We see that the AUC increases, and we get a true positive rate of 92% for a false positive rate of 1%. Since these values are very close to those in Experiment 1, we can argue that rotation and re-compression do not hinder significantly the performance of the source identification system.
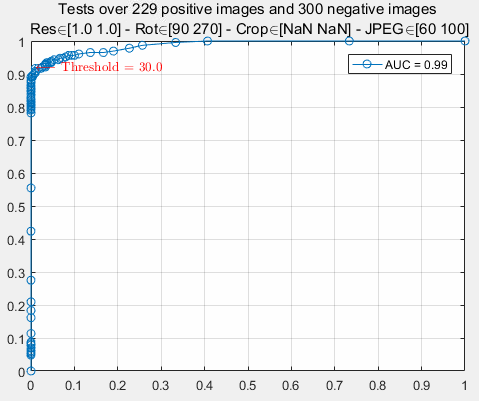
Figure 4: results in presence of rotation and re-compression only
Now, let’s compare results when images are resized, rotated and compressed at slight or moderate quality (Figure 5). We notice that stronger JPEG compression negatively affects the performance of the system, leading to approximately a 10% loss in terms of true positive rate.
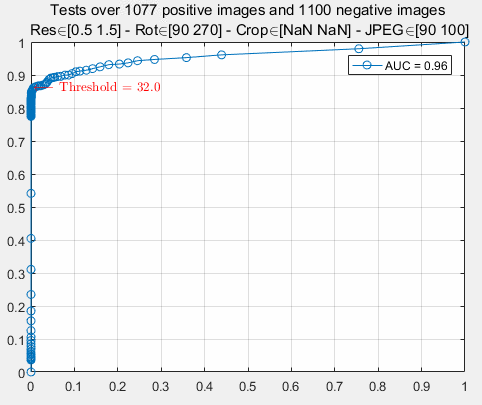
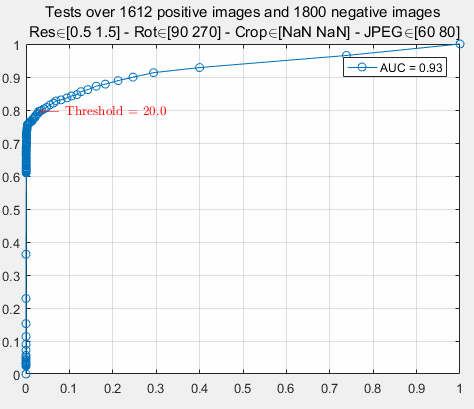
Figure 5: results in presence of resize, rotation and slight (top) or strong (bottom) final compression
We find it interesting to compare the effect of down-scaling (top plot in Figure 6 to that of up-scaling (bottom plot in Figure 6). It is evident that device identification is harder to achieve when the image is downscaled (73% true positives for 1% false positives), while upscaling does not affect performance significantly (89% true positives for 1% false positives).
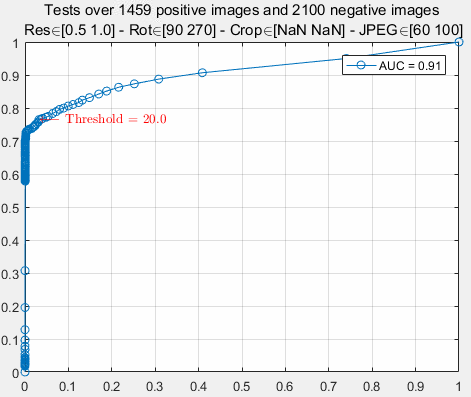
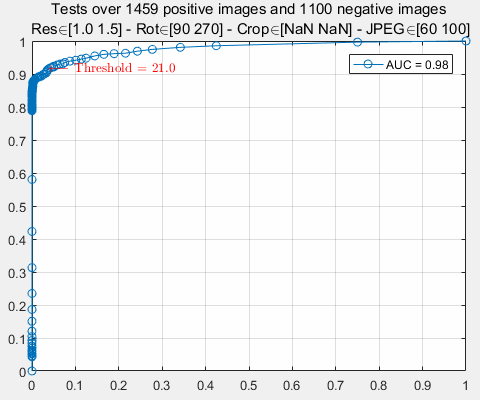
Figure 6: comparison between down-scaling (top) and up-scaling (bottom)
As to the rotation factor, Figure 7 shows that it is rather uninfluential, meaning that different rigid rotations do not influence the accuracy of the system.
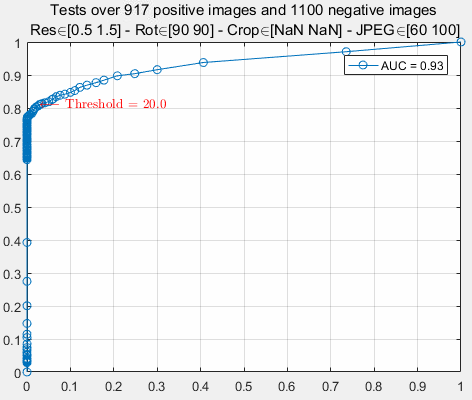
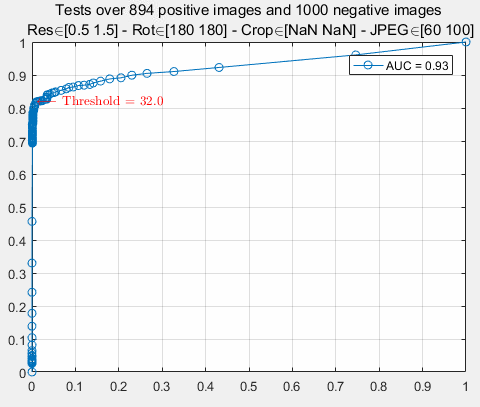
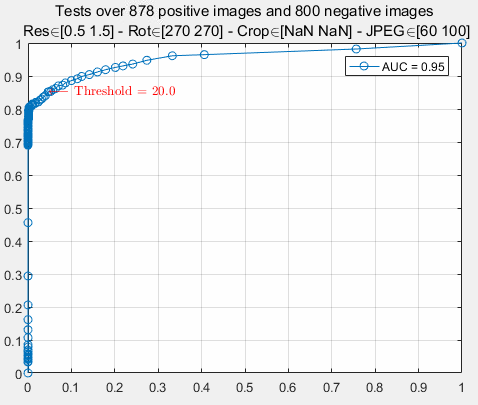
Figure 7: impact of rotation factor
Experiment 3: camera identification in presence of cropping, rotation and JPEG re-compression
This experiment is similar to Experiment 2, but resize is substituted by crop. Images are processed applying cropping, followed by rotation and final JPEG compression. Parameters for each processing step are as in the following Table.
| Processing | Parameters |
| Cropping | Frame cropping, randomly chosen in the interval 0-20% of the image size |
| Rotation | Randomly chosen between 90, 180, 270 degrees |
| JPEG compression | Randomly chosen between [60, 70, 80, 90, 100] |
Results are shown in Figure 8. We see that performance is in line with those of the resize case (see Figure 3).
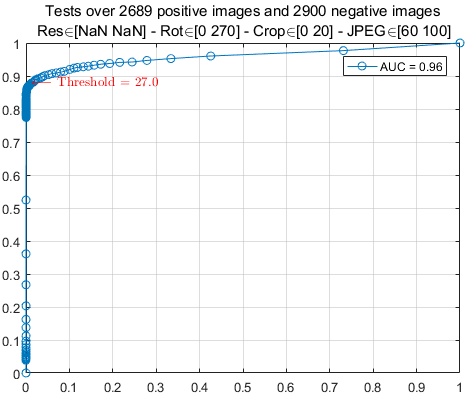
Figure 8: results in presence of cropping, rotation and compression
Similar to the previous case, the final JPEG compression plays an important role: when the last compression is at good quality (left plot of Figure 9), the effect of cropping on performance is very limited. On the other hand, when the compression is moderate (right plot of Figure 9) the system loses around 10% in terms of true positive rate.
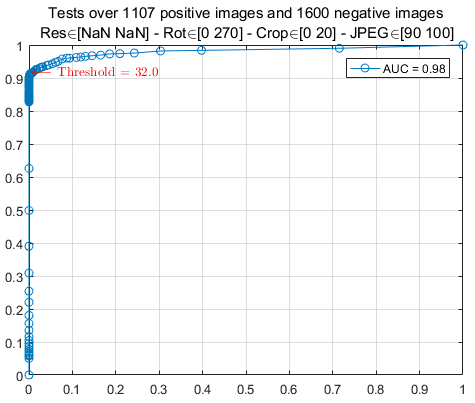
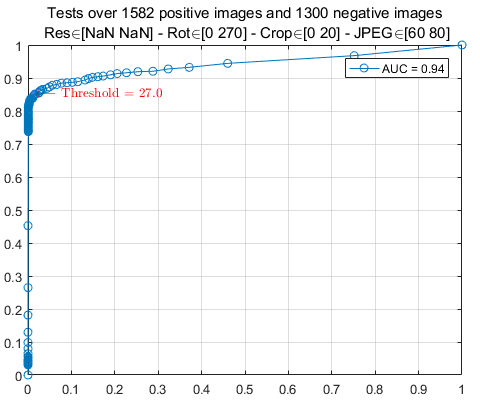
Figure 9: influence of slight (top) and moderate (bottom) JPEG post-compression in presence of cropping
Interestingly, the amount of cropping is not as relevant: as Figure 10 shows, the fact that a small (left plot) or relevant (right plot) amount of cropping is applied does not influence performance significantly.
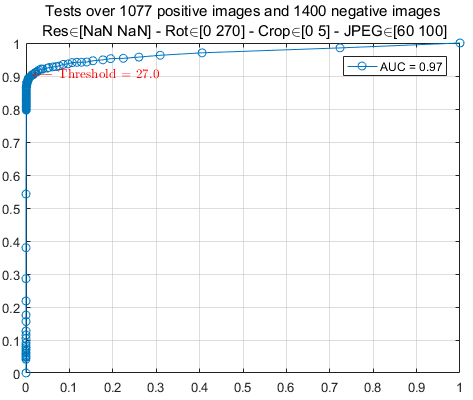

Figure 10: impact of the amount of cropping (top plot: small amounts – bottom plot: relevant amounts)
Experiment 4: discriminating different exemplars of the same model
This experiment investigates if the source identification system can discriminate images generated by different exemplars of the same brand and model. We tested 5 different models, two exemplars each, as explained in the following Table:
| Make | Model | Type | Year | Resolution | Exemplars |
| Apple | iPhone 4s | Phone | 2011 | 8MP | 2 |
| Canon | EOS 10D | DSLR | 2003 | 6MP | 2 |
| Canon | EOS 40D | DSLR | 2007 | 10MP | 2 |
| Casio | Exilim EX-Z70 | Compact | 2006 | 7MP | 2 |
| Olympus | D-560 | Compact | 2003 | 3MP | 2 |
During experiments, 40 images were used for each device to create the reference pattern; all remaining images from the same exemplar were used as the positive set. The negative set is composed by all available images coming from a different exemplar of the same brand and model, plus a random choice of images coming from different devices.
As Figure 11 shows, performance is totally in line with those in Experiment 1. This experiment suggests that the source identification system effectively discriminates images coming from different devices even when they belong to the same brand and model.
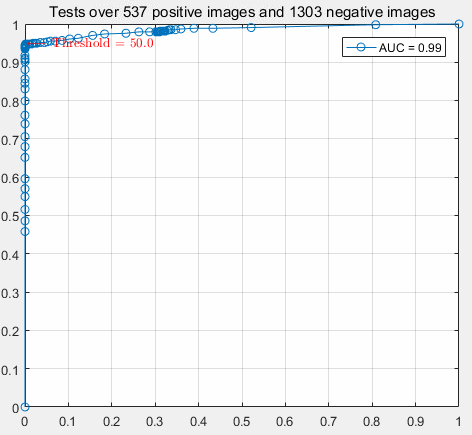
Figure 11: performance when devices of the same brand and model are considered
Experiment 5: investigating the impact of the number of images used for CRP computation
One key step in source device identification is CRP estimation. When the device is available, the best practice is to take some shots of a flat wall or a sunny sky (so-called “flat-field” images), with no zoom and with little or no compression, and then use them for SPN estimation. In many cases, however, the device is not available: a reliable SPN estimate can still be obtained also from “common” images, but in this case, a greater number is recommended.
In this experiment, we investigate how the number of images used for SPN estimation impacts system performance. In our dataset, for most devices, we have natural images only, while flat-field images are available for three of them (Table 3). Notice that, for this experiment, we excluded the Lumix DMC-TZ3 device as it behaved as a negative outlier in Experiment 1, and would complicate interpretation of results.
| Make | Model | Type |
| Apple | iPhone 4 | Flat-field |
| Canon | Powershot A75 | Flat-field |
| Casio | Exilim ex-z70 | Flat-field |
| BenQ | DC4330 | Natural |
| Canon | Powershot s2is | Natural |
| Canon | Powershot SD630 | Natural |
| Canon | IXIUS v2 | Natural |
| Casio | Exilim ex-z60 | Natural |
| Casio | Exilim ex-z75 | Natural |
| DigCam | Sub-6MP | Natural |
| Fujifilm | Finepix A350 | Natural |
| HP | Photosmart 320 | Natural |
| Nikon | e-coolpix-s570 | Natural |
| Nikon | D70 | Natural |
| Nikon | D80 | Natural |
| Nikon | D100 | Natural |
| Nikon | D300 | Natural |
| Nikon | e2500 (Coolpix 950) | Natural |
| Nikon | e885 (Coolpix 885) | Natural |
| Nikon | E7900 (Coolpix 7900) | Natural |
| Nikon | E880 (Coolpix 880) | Natural |
| Nokia | n95 | Natural |
| Olympus | u760 | Natural |
| Olympus | E300 | Natural |
| Panasonic | Lumix dmc-fs15 | Natural |
| Pentax | Optios | Natural |
| Premier | DC-3320 | Natural |
| Sony | Cybershot | Natural |
Table 3: list of devices used in Experiment 4, specifying the type of images available for SPN estimation.
We repeated Experiment 1 separately for these two groups, while iteratively increasing the number of images used for estimating the SPN, moving from 5 to 50. This means that, at each iteration, a new group of images was
added to SPN estimation, while retaining those used in the previous step. Results are in Figure 12 for the case where natural images are available, and in Figure 13 for the case where flat-field images are available.
Plots highlight two relevant facts:
- When natural images are used for SPN estimation, performance improves significantly until 30 images are used, then converge.
- In the case where flat-field images are used for SPN estimation, performance converge is much faster, so that using 20 or 50 images does not make a relevant difference.
The above facts are totally in line with the theory about SPN estimation. It is well known, indeed, that a better estimate is obtained when reference images have little variance (as flat-field images do). On the other hand, when natural images are used, it takes more of them to reach the same SPN pureness (which leads to better device identification). Intuitively, this is because there is more content-related information to be “averaged away”.
From a practical point of view, this experiment suggests that, if natural images are used for SPN estimation, at least 40 images should be employed. This number can be lowered to 20 when flat-field images are used. We should consider, however, that for the flat-field case our dataset contained only three devices, which does not allow us to reach strong conclusions.
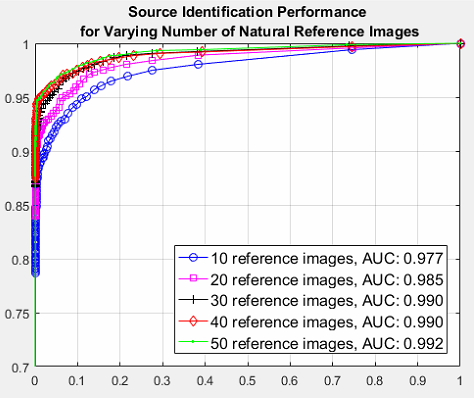
Figure 12: ROC curves obtained using different amounts of natural images for SPN estimation
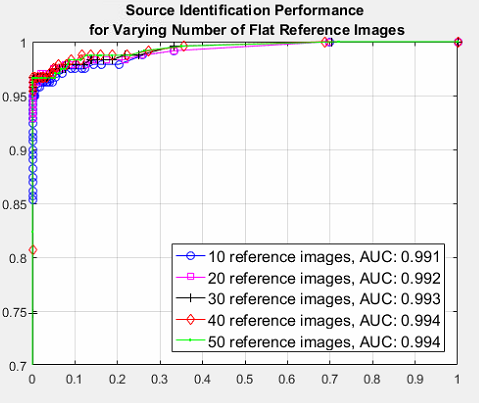
Figure 13: ROC curves obtained using different amounts of flat-field images for SPN estimation