Otherwise known as ‘The Science of Single View Metrology’
The first common question asked to a forensic video analyst is, “Can you tell me what that license plate is?”. The second question is, “What is the height of that person?”.
It is then the forensic video analyst’s responsibility to analyze the video, assess its suitability to answer the question, process and prepare the images, and then finally use science to provide the answer, based on facts.
Taking a ‘workflow’ approach can often safeguard the user from missing vital information that may be relevant further along in the process.

There are a few different methods to attempt an answer to this height question, with different constraints, reliability, and drawbacks. In this post I will be taking an in-depth look at the technique built into Amped FIVE, using the filter Measure 3d.
Analyze
It’s common to break this part down into 3 components: Exhibit, Data, Visual.
The Exhibit Analysis will look at the continuity of the video or image(s) that you are to examine. If there are large, unknown elements in this section, causing gaps in exhibit integrity, is it worthwhile continuing or should you clarify some issues first?
The Data Analysis deals with the Metadata. It is vital to examine this information to understand the makeup of the video. This ensures correct interpretation of the visual data later. You may also refer to this during the following stages when, and if, required.
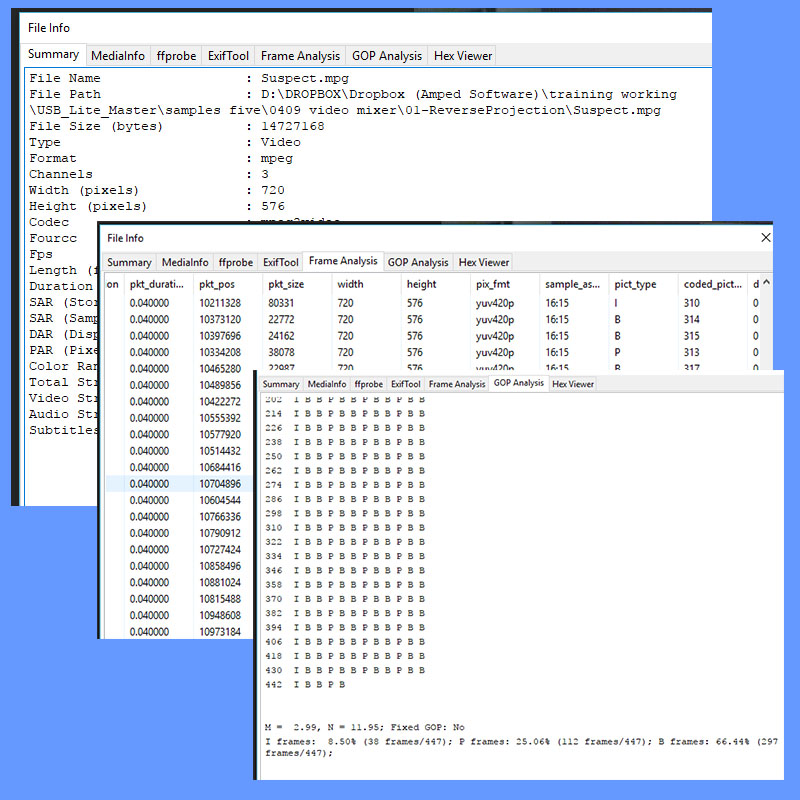
The Visual Analysis then puts everything together. In my test video used here, the Data Analysis revealed signs of Interlacing and this is confirmed visually. This will be important as the two fields are two different moments in time. We must not just throw one of these away! We must not simply blend the two together. They must be separated and analyzed individually.
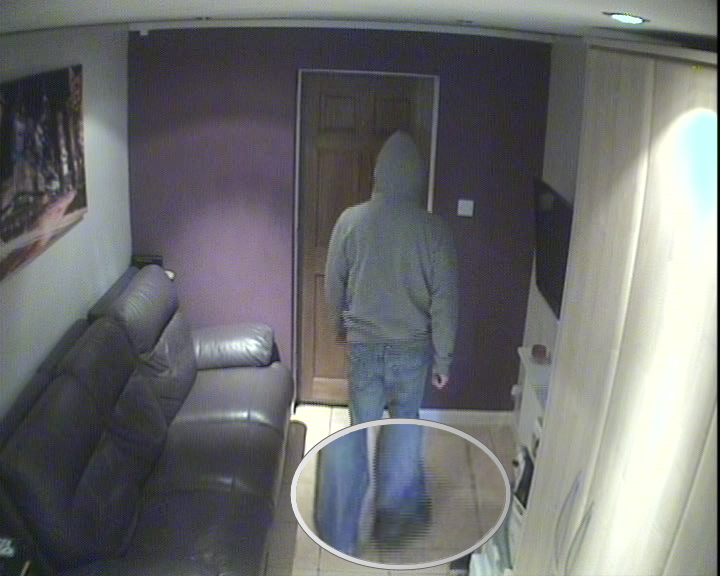
I can also see several other issues that must be considered:
- There is a visual distortion on straight edges caused by the camera lens. Will this affect height analysis later? For me to conduct height analysis I need to identify straight edges. So the answer is yes – these curved edges will need to be straightened!
- I have a 720 x 576 frame size, but my data analysis revealed a 4:3 Display Aspect Ratio calculated from the 16:15 Sample Aspect Ratio of each frame. Do I need to adjust this? Well, to answer that question, we must consider how the image was generated and then attempt to reverse the issues encountered. We will look more at this when it comes to processing the images.
- Do I need to correct the rotation of the image to make vertical lines truly vertical? Maybe, although it will not affect calculations. It’s something to consider when cameras are positioned at an acute angle, but it really only assists display presentation.
Assess
We must now identify the suitability of the image for the task by asking a series of questions:
- Do I have at least 2 parallel lines in 3 different directions in the space?
- How long are these lines?
- Can I identify them accurately?
- Can I trust they are actually parallel in the real world, but looking convergent because of the perspective effect?
Before we move on to other considerations, let’s just look at these ‘lines’ for a moment and understand why they are important.
We must be able to put some ‘perspective’ into the 2-dimensional image. This, obviously, was a 3-dimensional scene so we must be able to identify the scene perspective.
We do this by using the Vanishing Points of two parallel lines to identify key parameters.
Very often, these vanishing points can be some distance out of the original image and taking a manual approach to identifying and calculating our lines can be very time-consuming.
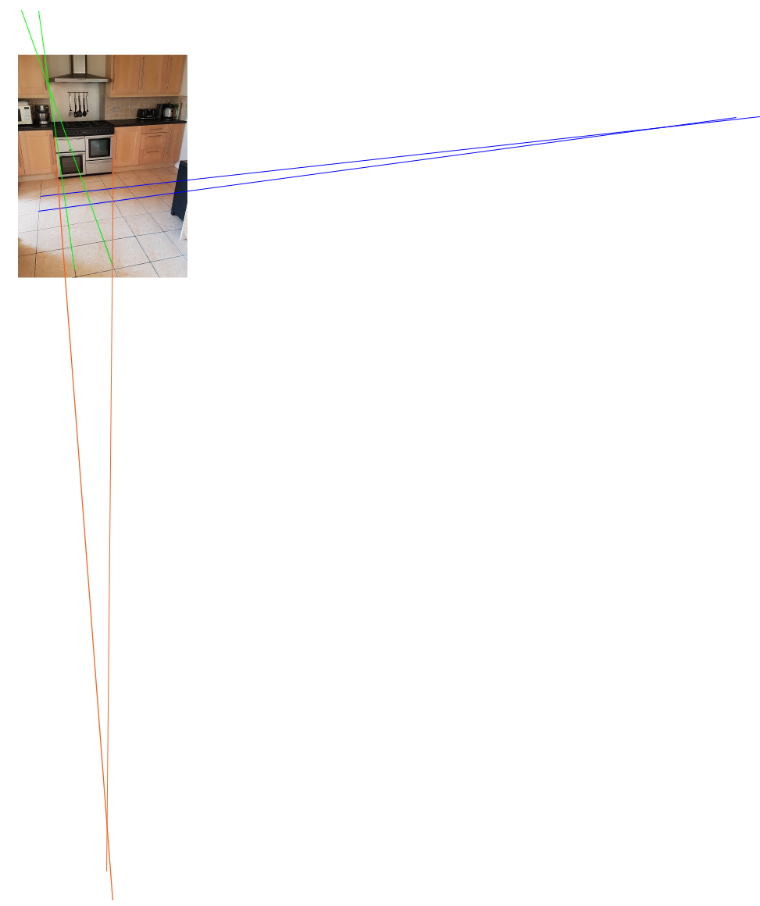
In this example image, I have used the tiles on the floor to show the X and Y planes (blue and green), then the oven edges for the vertical Z plane (orange). The point at where the lines cross is the vanishing point.
Without these lines, or the ability to place suitable objects into a scene, we would be unable to calculate unknown measurements using the images alone.
Now that we have acknowledged the presence of suitable lines, let’s ask some more questions:
- Do I have (or can it be obtained) a known height measurement within the image to act as reference?
- Is the ground plane flat?
- Is the subject I want to measure based on the same plane as the object used as reference?
- Are the images of the suspect of sufficient quality?
The most common problem here is the suspect only being in partial view, i.e. not seeing their legs or feet! There could be other problems such as the suspect bending, or moving. The image quality may also be a factor with camera position, high digital compression, artifacts or motion blur causing image difficulties. Some of these may be fixable but others may make the images unsuitable.
Assessment Checklist:
- X,Y and Z plane parallel lines
- Known reference measurement on vertical plane
- Flat ground
- Suspect fully visible
- Sufficient quality
Process
This is the stage where we select and prepare our images for the height analysis. After understanding what we are starting with, and having a successful assessment of the suitability for height analysis, we have some work to do before we start calculating heights.
The first thing we must do is deinterlace the images correctly.
Interlaced Images
It is still very common to deal with the effects of interlacing. More often, we are not dealing with an entire interlaced recorded frame, but a single field. 704 x 288 (PAL) or 204 x 240 (NTSC) is one of the most common pixel dimensions and is created through the retention of a single field. (See a recent post here, discussing exactly this.)
Deinterlacing requires some form of interpolation, the insertion of an intermediate value by estimating or calculating it from surrounding known values.
When deinterlaced and put to the correct height, if we didn’t add in data, below is what the image would look like.
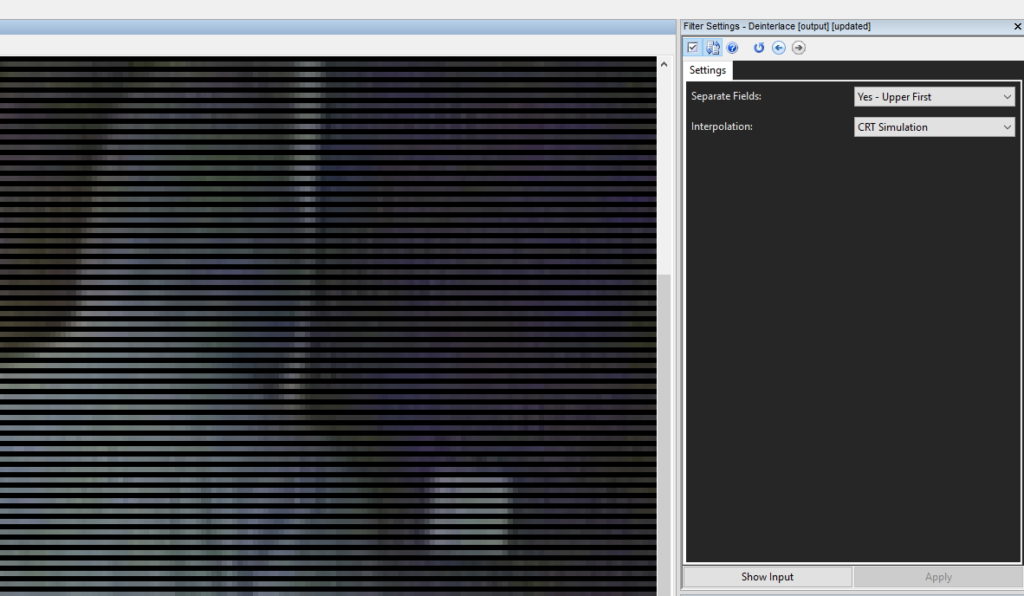
There are no missing lines. The empty data is another moment in time. An interlaced frame is two moments in time, seen together.
Understanding what we have, what we are seeing, and why, is vitally important when deciding how to process the images for the required task.
But how are we going to deinterlace? What interpolation method are we going to use?
In order to answer this, we must look at all our image transformation requirements as a whole rather than individual processes. If we chose one type for one process, and then another type for the next, the first choice would be canceled out.
After deinterlacing the fields to individual frames, I now need to select the images that are most suitable for the task.
Using the Sparse Selector, I have chosen the 5 images where the suspect body is vertical and I can see the top, to the footwear.
When we conducted our data and visual analysis, we learned that there was an Aspect Ratio issue and a Lens distortion problem.
We must correct those to ensure that the image we are viewing is a true and accurate representation of the scene. The order they are corrected is also important as it relates to how the image was created. Aspect ratio changes, from the original scene to the recorded data, occur in the storage stage. As a result, this must be corrected first.
The data analysis revealed that the correct Display Aspect Ratio (DAR) was 4:3.
Rather than rewrite A LOT on this issue, take a look at these posts:
As you can see there is a lot to take into consideration. The only way to really know what method of AR adjustment is required would be to conduct the sphere test at the scene.
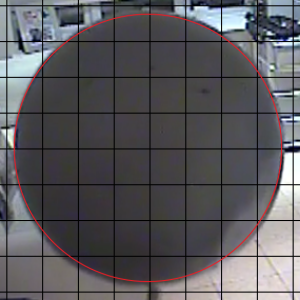
I have now adjusted my Aspect Ratio to 4:3 resulting in a 768 x 576-pixel image. For this purpose, I have again been forced to use a method of interpolation to add in values.
We must now correct the lens distortion.
I have also rotated the image after to correct the slight camera twist.
That’s two further filters, both required to perform image corrections.
As a reminder we performed:
1. Deinterlace
2. Aspect Ratio
3. Undistort
4. Rotate
All of these require interpolation, and we must ensure that we use the same method.
How do we decide which one is suitable for these images, for those moments in time, from that specific system?
Testing!
There are so many reasons why I love using Amped FIVE, but testing and analyzing images using different parameters is pretty high up my list of favorite reasons.
It doesn’t take very long to duplicate my initial chain, save the project as something new and then conduct some assessment of different interpolation methods.
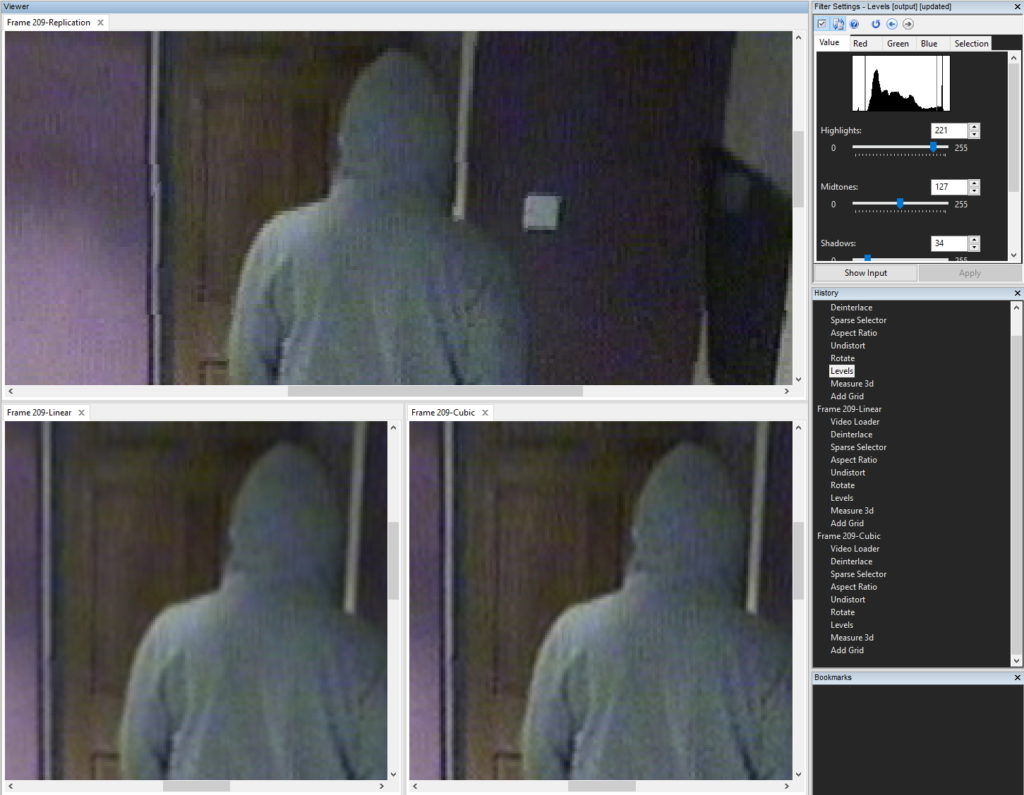
Due to the changes in straight lines, and the uneven interpolation required, it was evident that Nearest would not be suitable.
Bicubic, although appearing to produce darker edges, also produced some artifacts around feet and hood. As these were important to be used on height start and end points, I used Bilinear Interpolation during every transformation filter.
There are times, when initial and processed images are the same size, that the Mixer filter can be used along with Sum of Absolute Difference, to give a value to any differences between images.
Obviously, the lower the value, the near the image is to the original.
The last piece in the image processing jigsaw is a levels adjustment. I had already increased my viewable values to full, during the initial video loader stage, but I now need to get as much information as possible without over/under saturating.
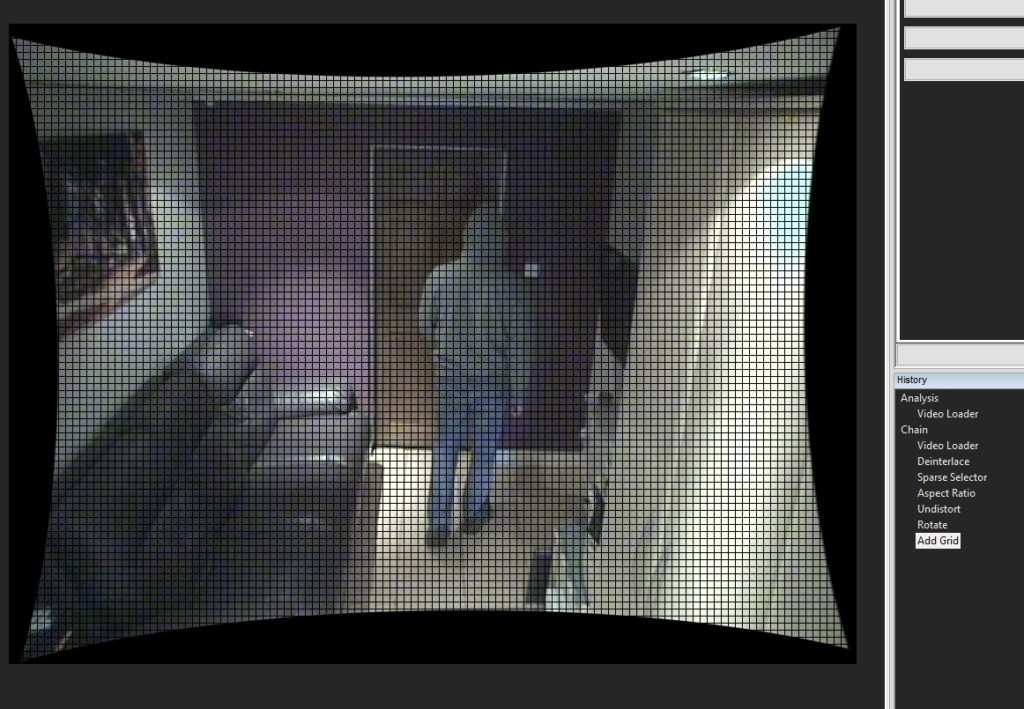
We now have several images all processed the same, in a single chain. Now it’s time to perform a different measurement on each image.
Calculate
Using Measure 3d we can add in our plane lines. These are the parallel lines that will be used to calculate the image’s perspective.
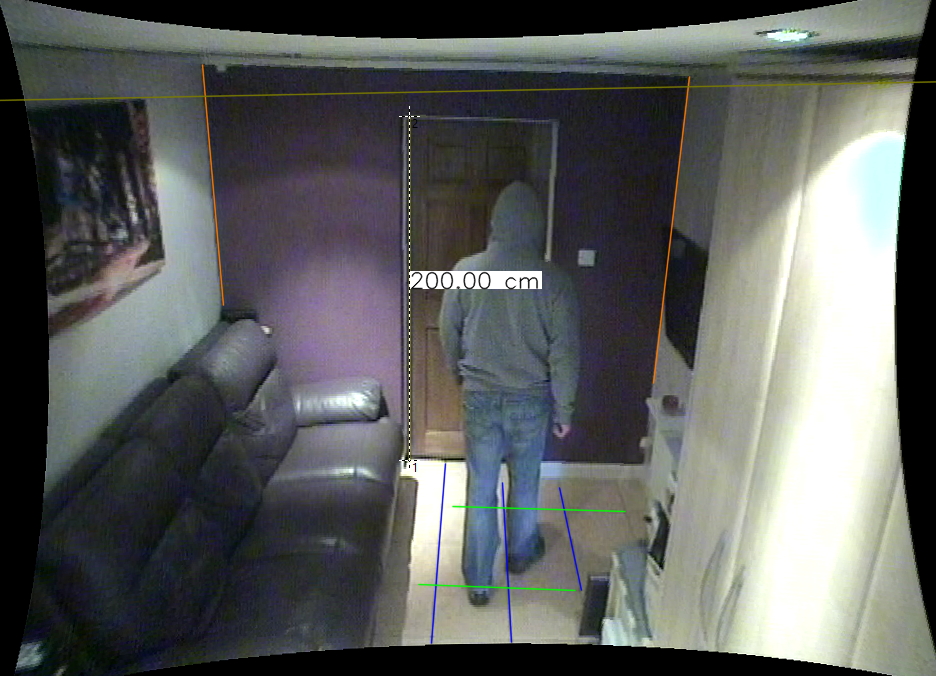
The longer the lines, the more accurate the final calculation.
You will also see that I have also added in my known height reference measurement. The floor, to the top of the white door frame was 200 cm.
It’s a simple process of following the tabs.
Add in the X Axis, add in the Y, then add in the Z.
As you can probably now see, if I have not processed my images correctly prior to conducting the measurements, my image would not conform to reality. Therefore, any results would be wrong.
When the reference measurement is applied, an automatic calculation of Camera Position is presented.
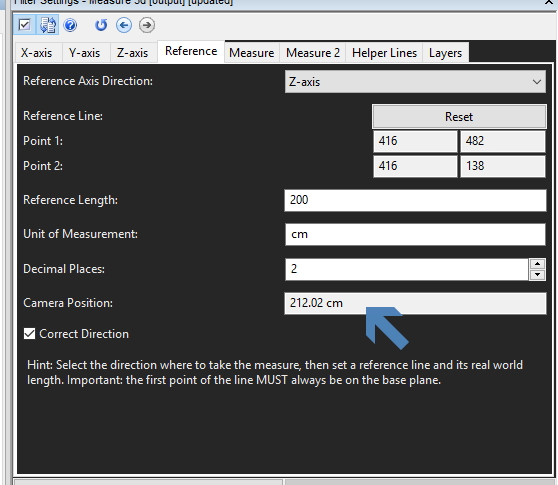
Not only can we see the height of the camera as a calculated figure, we can visualize this on the image by enabling the Horizon Layer.
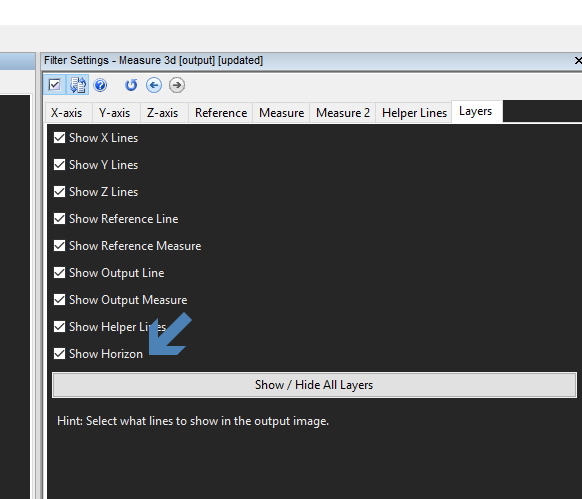
In the image earlier, whilst adding in the reference measurement, you can see the horizon as a line across the top of the image.
The final stage is to measure our suspect.
When viewing subjects from the side, it may be possible to draw in an imaginary cross under their body. This helps in identifying the central line up through the body.
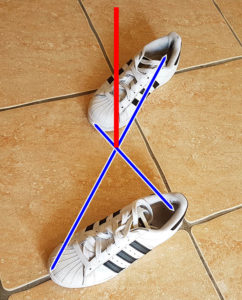
In Amped FIVE, just use the Helper Lines tab within the Measure 3d filter to draw your lines in.
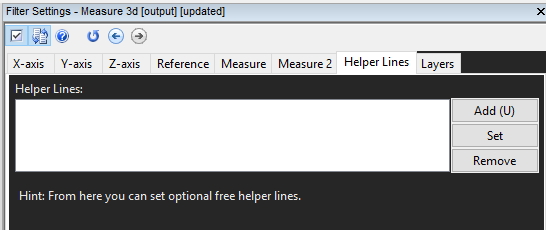
In the images we have here, this is, unfortunately, not possible. I have had to use the feet position during the steps to identify the start of my vertical line.
The other point is the hoodie! Exactly where the top of the head is, under the hoodie, is an unknown variable.
I can visualize the block structure in the encoding. As this encoding type uses prediction, there will be another unknown variable here. That is, where does the hoodie end in reality?
Lastly, footwear. The image quality does not allow the identification of footwear so this is also an unknown variable.
Regardless of these unknown variables I can only use the information I have in front of me and therefore I have selected the top of the hoodie on each image.
Amped FIVE will automatically calculate an error rate based on the pixel amount in a selected area in relation to its position with the perspective. The larger the area and the fewer pixels – the higher the error rate will be. Therefore, my answer to the question of height will be a range, which will be based on this error rate and across the range of images selected. This range will take all unknown variables into account.
After placing my measurement line, I have the height calculation of my first image. Now it’s time to do the same for the other images selected.
It would be great if I had another camera angle, or perhaps even images from another system. The more measurements the better.
In Amped FIVE, there are several different ways of conducting individual measurements on different frames. The way I will use here is my preferred method, as it retains the complete process chain for each final image and avoids creating intermediate data.
I started with 5 images so I will duplicate my chain 4 times. (Remember: You can use Drag/Drop or use Copy/Paste from the right click option menu).
To make things easy for me, I’ll rename my chains with the frame number that I will use for the measurement. Those frame numbers were retained from the original video so it assists with repeatability by helping other people identify where those images were within the original footage.
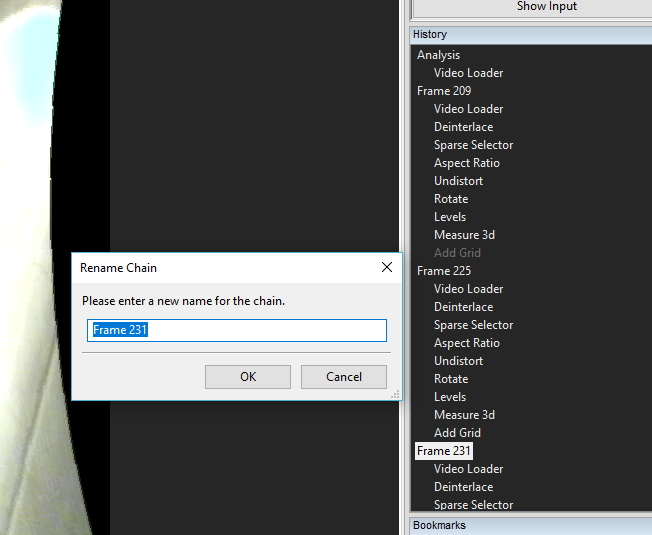
I have copied the entire chains, including the Measure 3d filter. To adjust this for the next image, it is a simple process of hitting the Reset button on the measurement and placing in your new line for that image.
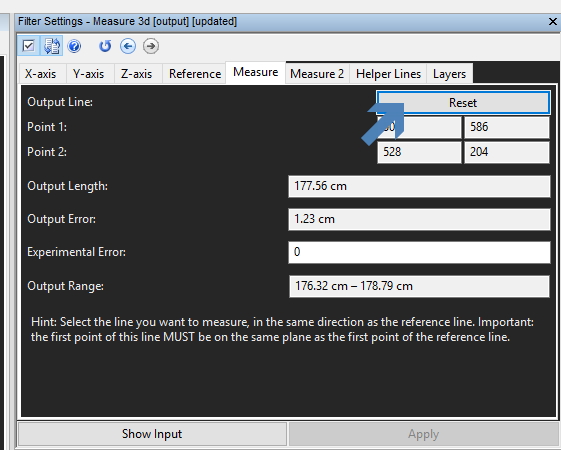
You must remember to use the same methodology in selecting your start and end point for each image.
After doing each image, in each chain, I hit the bookmark key (U). Within 5 minutes I have my 5 images – it’s all easy in Amped FIVE!
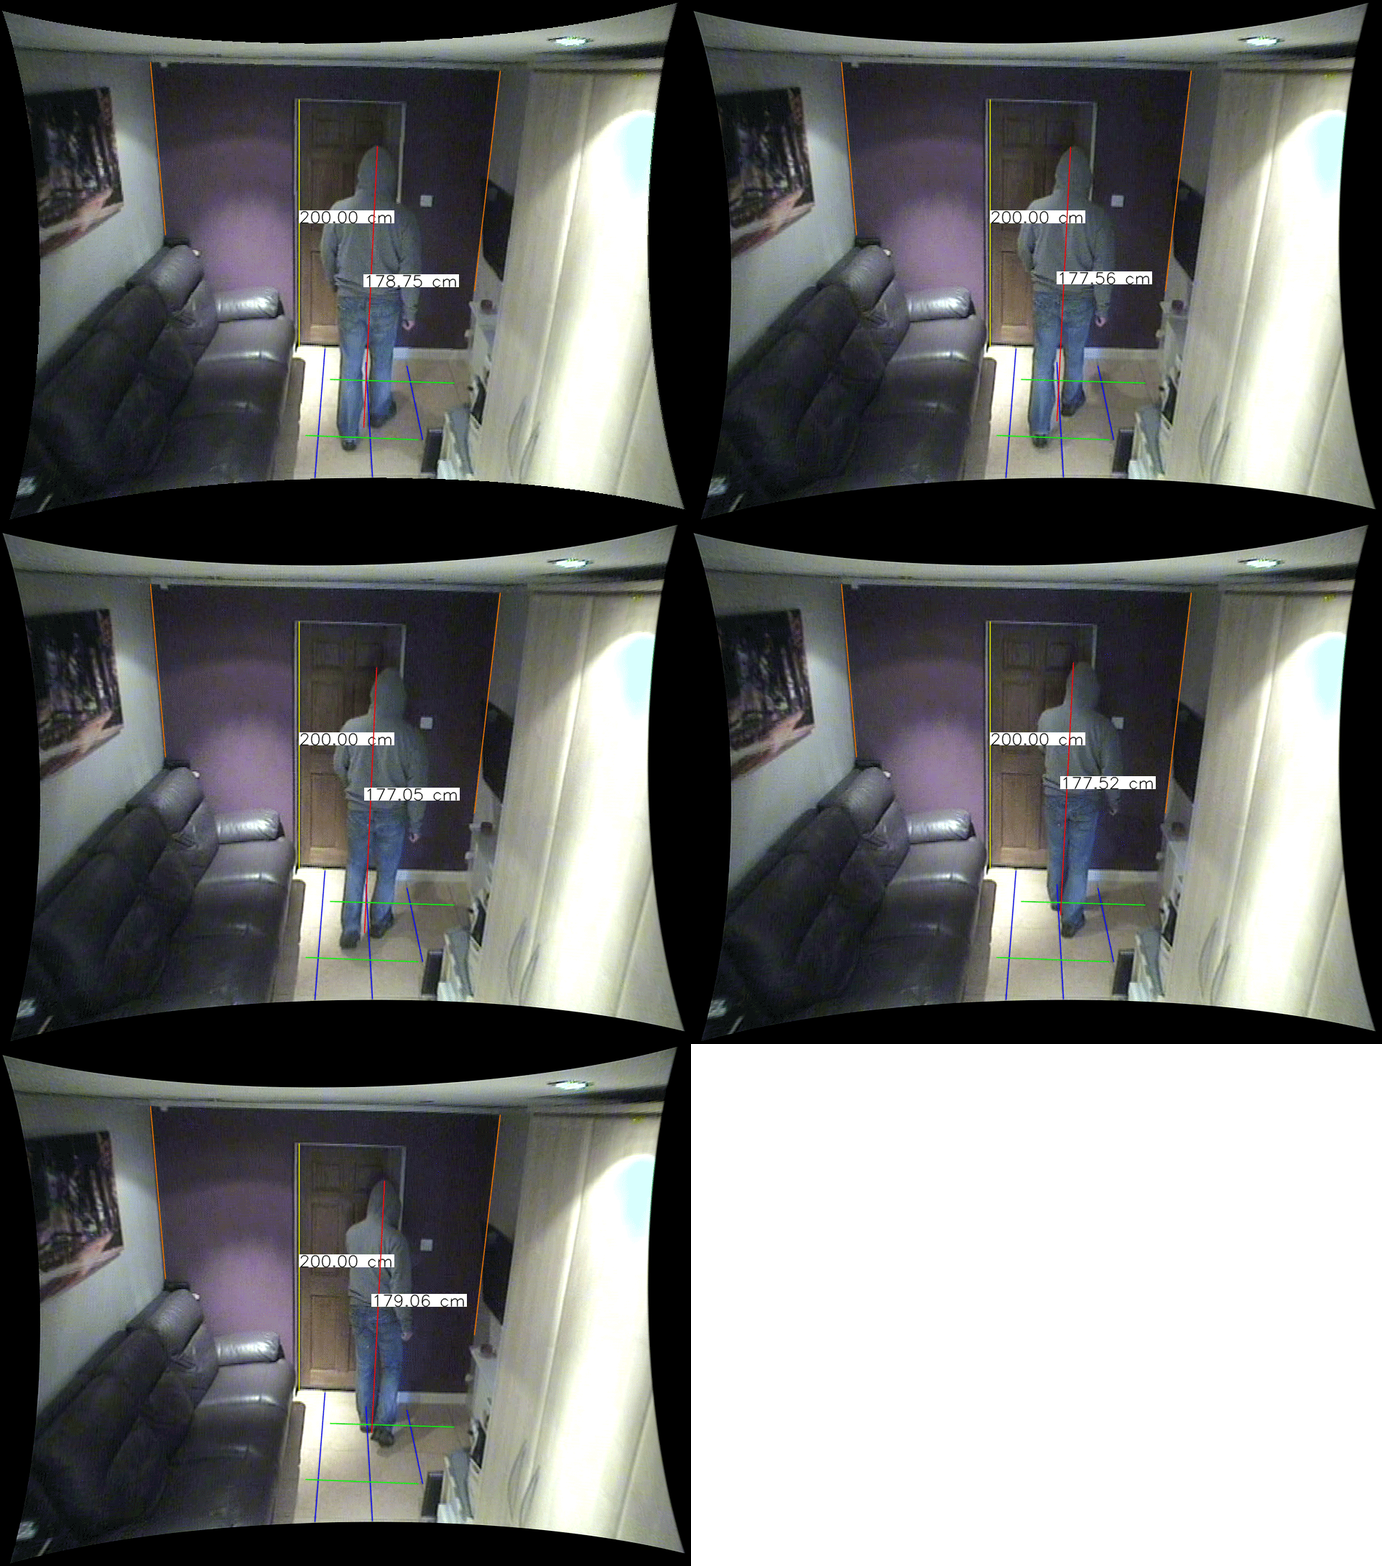
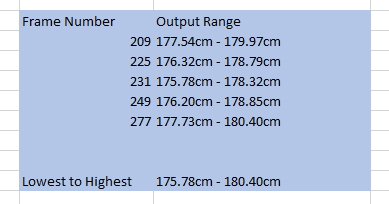
Each calculation will have an output error and an output range.

All the relevant information from each image used can be loaded into a spreadsheet.
After all this, let’s now go back to the initial question: “What is the height of that person?”
Based on the forensic video analysis and subsequent measurements of the target subject, I have identified a height range of between 175.78 cm and 180.40 cm.
With more testing, we could have done a more rigorous statistical analysis of the error, but this is already a pretty good start.
Using the Science of Single View Metrology, we have very quickly been able to answer the question – but is it correct?
The person in that picture is me! And I’m 178 cm.
Now, before you suggest that I knew my height beforehand, and as such was tainted with unconscious bias, I thought my height was 181 cm! I completed the first three measurements and thought something was wrong. I then finished the other two measurements and then had assistance in getting my height to be sure. After removing my shoes and having my height checked, it revealed that my analysis was correct – I was the one who was wrong!
Conclusion
This has been an unusually long blog post, but one that I have been meaning to write for a long time. For me, it highlights that conducting the measurements is only a small part of the story. Preparing the images correctly is vitally important as this can dramatically alter the calculated values.
Lastly, it’s having the ability to do everything within a single piece of software. Whatever I am tasked with, whether it’s video for presentation, preparing my images for analysis, understanding my evidence, conducting processing techniques to restore or enhance, or calculating measurements of unknown targets.
With Amped FIVE, you have the ability at your fingertips!


